Explainer · Markets & Macro
Bull and bear markets: definitions and history
Bull and bear are labels for long stretches of rising or falling prices. They describe what already happened, not what comes next, and the history behind them is a lesson in how deep and long a fall can be.
Quick answer
A bull market is a stretch of rising prices and optimism; a bear market is a stretch of falling prices and pessimism. As a rule of thumb, the SEC uses a rise or fall of 20% or more in a broad stock index over at least two months [1] [2].
Key points
- The SEC's rule of thumb for a bear market is a fall of 20% or more in a broad index over at least two months; it says "generally", so this is not a legal line [2].
- FINRA calls a reversal of at least 10% a correction, and says the bear market term can also describe a falling bond index or commodity price [3].
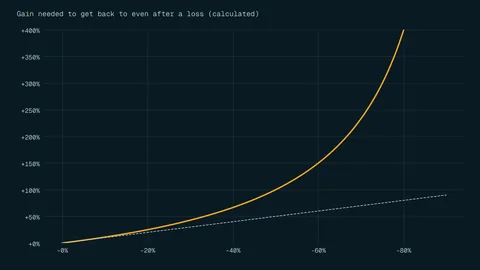
- Falls and recoveries are not symmetric: after a 20% fall you need a 25% gain to get back (calculated).
- After the 1929 crash the Dow ended 89% below its peak and did not regain it until November 1954 [4].
- The labels are applied after the fact. They do not tell you when a market will turn.
On this page
What is the difference between a bull and a bear market?#
A bull market is a time when stock prices are rising and investors feel optimistic. A bear market is the opposite: prices are falling and the mood is pessimistic. Those are the SEC's own plain definitions on Investor.gov [1] [2].
To put a number on it, the SEC gives a rule of thumb. Generally, a bull market is a rise of 20% or more in a broad market index over at least a two-month period, and a bear market is a fall of 20% or more over at least two months [1] [2]. FINRA uses the same 20% threshold for a bear market and adds that the term can also describe a falling bond index or commodity price [3]. Between the two sits a smaller move, the correction: a reversal of at least 10% [3].
The table puts the three terms side by side, in the words the regulators use.
| Term | Rule of thumb | Mood the term describes |
|---|---|---|
| Bull market | A broad index rises 20% or more over at least two months | Optimistic |
| Bear market | A broad index falls 20% or more over at least two months | Pessimistic |
| Correction | Prices reverse course by at least 10% | Not part of the definition |
Bull and bear rows: SEC Investor.gov [1] [2]. Correction: FINRA [3]. The SEC introduces both thresholds with "generally".
How do you measure a 20% fall?#
Every bear market measurement starts from a peak, the highest level before the fall. You compare today's level with that peak, not with last week or with the price you paid. The formula is the same one used for any percentage change.
fall from peak (%) = (current level - peak level) / peak level × 100
- Pick a broad index
The SEC's rule of thumb refers to a broad market index, not a single share [2].
- Find the peak
Note the highest level the index reached before the fall began.
- Calculate the fall
Use the formula above. A result of -10% or worse is correction territory, -20% or worse is bear market territory [3].
- Check the time
The SEC's version also asks for a period of at least two months [2]. A one-day plunge is not, by itself, a bear market.
- Work out the climb back
Gain needed = fall / (1 - fall). The deeper the fall, the bigger the gain needed just to get back to the peak.
The 50% row is the example used in a 2016 study of how people misjudge losses: a 50% loss needs a 100% gain to break even [5]. The same arithmetic is behind our page on drawdown recovery, and you can try your own numbers in the drawdown recovery calculator.
What did past bear markets look like?#
Two episodes in the US stock market show how different bear markets can be. The Federal Reserve's history essays describe both.
The first is 1929. During the 1920s bull market, the Dow Jones Industrial Average rose six-fold, from 63 in August 1921 to 381 in September 1929 [4]. Then came the crash. On Black Monday, October 28, 1929, the Dow fell nearly 13 percent [4]. The slide continued until the summer of 1932, when the Dow closed at 41.22, 89 percent below its peak, and the index did not return to its pre-crash level until November 1954 [4]. That is about 25 years after the September 1929 peak (calculated).
The essay reports index levels; it does not say whether they account for dividends or inflation, so treat the figures as price levels only.
The second episode is much shorter. On Monday, October 19, 1987, the Dow finished down 508 points, or 22.6 percent, in a single session, a fall the 2013 essay calls the largest one-day stock market decline in history [6]. Within two trading sessions the Dow had gained back 288 points, or 57 percent of the loss [6]. One fall lasted years; the other was concentrated in one day. Neither is a template for the next one, and a quick partial rebound is not something any source promises.
What happens when prices fall very fast?#
After the 1987 crash, regulators developed rules known as circuit breakers, which let exchanges halt trading temporarily during exceptionally large declines [6]. FINRA describes today's market-wide version for US stocks: the trigger is a fall in the S&P 500 from its closing price the previous day, and trading stops across all stock and futures exchanges [3].
| Trigger | S&P 500 fall | What happens |
|---|---|---|
| Level 1 halt | 7% | 15-minute halt, if before 3:25 p.m. |
| Level 2 halt | 13% | 15-minute halt, if before 3:25 p.m. |
| Level 3 halt | 20% | Trading stops for the rest of the day |
Market-wide circuit breakers for US stock and futures exchanges, as described by FINRA in June 2025 [3]. Each fall is measured from the S&P 500's closing price the previous day. Our source does not say these rules apply to crypto markets.
Single shares can fall faster than the index. FINRA explains this with beta, which measures how a stock moves relative to the market: a stock with a beta of 1.2 has historically moved 120 percent for every 100 percent move in a benchmark such as the S&P 500 [7]. If that past relationship held during a 20% index fall, the stock would fall 24% (calculated). FINRA's word is "historically", so treat beta as a description of the past, not a forecast. Read more about volatility.
Can anyone tell when a bear market starts or ends?#
Not in real time. A peak is only visible as a peak after prices have fallen from it, and the 20% line is crossed somewhere in the middle of the fall. By the time a market is called a bear market, much of the damage may already be done. The same is true in reverse for the low point.
Our sources give definitions, not a timetable. They do not give an average length or depth for bull or bear markets, and the two episodes in the Federal Reserve essays looked very different from each other [4] [6]. Headlines that announce a new bull or bear market are describing the past. If the label makes you want to act at once, read about FOMO trading first.
How can a beginner act in either kind of market?#
FINRA's advice for volatile markets is unexciting on purpose: set clear, prioritized goals, and stay diversified across and within the major asset classes [7]. Neither depends on guessing whether the market is about to turn.
In practice, that means deciding before a fall how much of your money could sit through a 20% drop without forcing you to sell, and keeping any trading money separate from it. If you trade, size each position from the loss you can accept, as our guide to position sizing shows, and check the economic calendar for scheduled news that can move prices.
Mistakes beginners make with bull and bear markets#
- Treating 20% as an official line
The SEC says a bear market "generally" starts at a 20% fall [2]. Nothing changes in the market at exactly -20%.
- Measuring from the wrong point
A fall is measured from the peak, and a recovery needs a bigger percentage gain than the fall: 25% after a 20% drop (calculated).
- Borrowing to buy the dip
Buying a falling market with leverage multiplies the next leg down as well. The CFTC warns that losses can exceed the deposit [8].
- Reading the label as a signal
Calling a market bull or bear describes what already happened. It does not tell you what prices will do next.
Frequently asked questions#
What is the difference between a bull and a bear market?
What is a market correction?
FINRA defines a correction as stocks, bonds, commodities or indices reversing course by at least 10 percent [3]. A correction can stop there or deepen into a bear market.
How long do bear markets last?
Do bull and bear market definitions apply to crypto?
The SEC's definitions refer to a broad stock market index, and FINRA extends the bear market term to bond indexes and commodities [3]. Our sources do not define them for crypto. The CFTC describes virtual currencies as more volatile than traditional currencies [9]; see why is crypto so volatile.
The bottom line#
Bull and bear are useful words for describing the past: a rise or fall of 20% or more in a broad index over at least two months. They are not signals. History shows falls can be sudden like 1987 or slow and deep like 1929, and recovering a loss always takes a bigger percentage gain than the loss itself. Plan for both kinds of market before they arrive, keep leverage out of it, and read the risk disclosure before you trade.
Sources
- Bull Market | Investor.gov.
- Bear Market | Investor.gov.
- Key Terms for Tough Times: The Vocabulary of Stressed Markets.
- Stock Market Crash of 1929.
- Downside financial risk is misunderstood.
- Stock Market Crash of 1987.
- Volatility | FINRA.org.
- Customer Advisory: Eight Things You Should Know Before Trading Forex.
- Customer Advisory: Understand the Risks of Virtual Currency Trading.
Education only. This page is not investment, tax or legal advice. Trading and crypto can lose you money. See our risk disclosure.