Glossary
Volatility: how much and how fast prices swing
Volatility is the size of the swings, not their direction. It decides how much a position can gain or lose in a day, and how far a stop order can slip when markets move fast.
Volatility is how much and how quickly a price moves up and down over a period of time. The bigger and faster the swings, the higher the volatility, and the higher the potential risk.
Quick answer
Volatility describes how wildly a price swings in a short time [2]. The bigger the swings, the higher the volatility and potential risk [1]. Swings do not cancel out: a 5% rise then a 5% fall turns $1,000 into $997.50 (calculated).
Key points
- FINRA: when a security, a commodity or an index fluctuates wildly in a short period of time, it is experiencing volatility [2].
- Equal ups and downs leave a net loss: +20% then -20% takes $1,000 to $960 (calculated), as research on downside risk explains [3].
- Volatility can jump around big news: in a study of the US Treasury market, prices were most volatile right at major announcements [4].
On this page
What does volatility mean in trading?#
Prices rarely move in a straight line. FINRA describes the everyday version: some days market indexes and stock prices move up and other days they move down, and this is called volatility [1]. In its vocabulary of stressed markets, FINRA adds the speed: a security, commodity or index that fluctuates wildly in a short period of time is experiencing volatility [2].
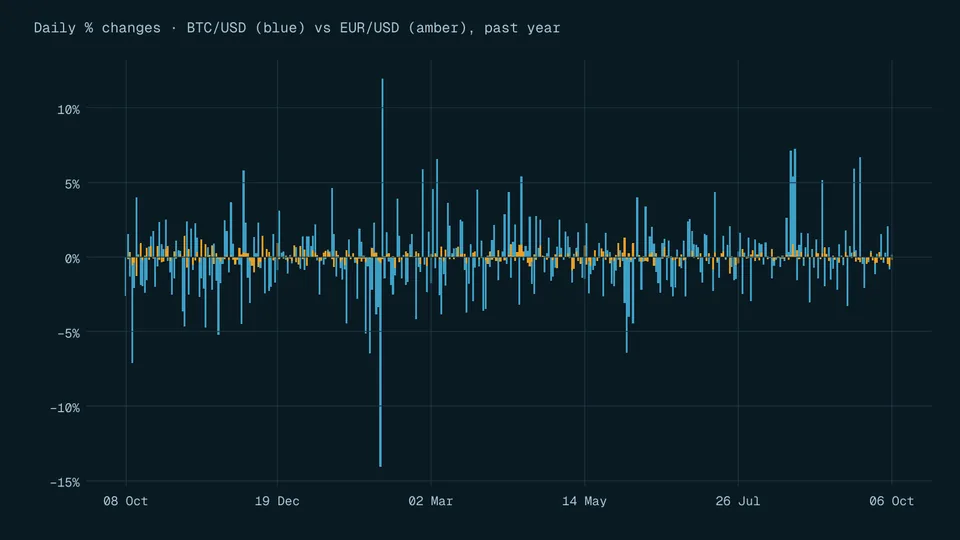
Volatility says nothing about direction. A share that jumps 5% one day and drops 5% the next is volatile even if it ends the week where it started. What it does tell you is how big a gain or loss a normal day can bring. FINRA's summary is that the more dramatic the swings, the higher the level of volatility and potential risk [1].
There is a second, less obvious cost. Gains and losses compound, so a rise and a fall of the same size leave you below where you started. Research on how people misjudge downside risk shows that a sequence of +x% and -x% gives a negative overall return, whichever comes first [3]. The bigger the swings, the bigger that loss, as the table shows.
| Path for $1,000 | After the rise | After the fall | Net change |
|---|---|---|---|
| Calm: +1% then -1% | $1,010.00 | $999.90 | -$0.10 |
| Volatile: +5% then -5% | $1,050.00 | $997.50 | -$2.50 |
| Very volatile: +20% then -20% | $1,200.00 | $960.00 | -$40.00 |
All figures calculated. The order does not matter: a fall followed by an equal rise gives the same result [3].
How is volatility measured?#
Two measures appear often in beginner material. The first is beta, which FINRA says measures how a stock moves relative to the market, not the total volatility of the stock [1]. FINRA's example: a stock with a beta of 1.2 has historically moved 120 percent for every 100 percent move in a benchmark index such as the S&P 500 [1]. If that past pattern held when the index fell 10%, the stock would fall 12% (calculated). The key word is historically: beta describes the past, not a promise about the next move.
The second is the VIX, which FINRA describes as a measure of the expected volatility of US stocks, based on investors' expectations of major market moves [2]. It looks forward, but it is still an estimate, not a forecast you can trade on safely. The sources we use do not cover statistical measures such as standard deviation, so we do not quote any here.
When does volatility rise, and why does it matter?#
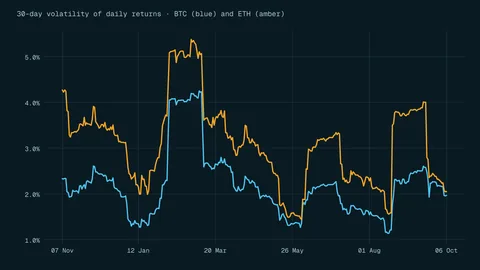
Volatility can jump when new information arrives. Researchers at the Federal Reserve Bank of New York found that in the US Treasury market prices were most volatile right at a major announcement, while trading volume was notably low, and that high volatility and volume then persisted for a while [4]. That study covers only the Treasury market, but it is a good reason to check the economic calendar before you trade. A more recent example comes from currency markets: the BIS says its April 2025 survey of currency trading took place amid elevated volatility and a surge in trading that followed trade policy announcements [5].
Volatility matters for every order you place. FINRA warns that in a fast-moving market a triggered stop order can be filled at a price significantly worse than the stop price [6]. It also raises what is at stake with leverage: the CFTC notes that virtual currencies are more volatile than traditional currencies and that the profits and losses from that volatility are amplified in margined contracts [7].
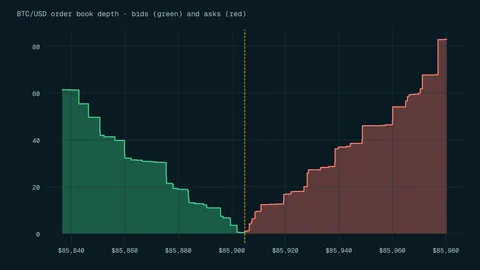
The practical answer is to size positions for the swings you can expect, not the ones you hope for. Our guide to position sizing shows how, and why is crypto so volatile looks at the most volatile market beginners meet. Volatility also interacts with liquidity, which FINRA describes as being able to buy and sell quickly without significantly affecting prices [2]. In the Treasury study, the bid-ask spread widened dramatically as volatility rose [4].
Frequently asked questions#
Is volatility the same as risk?
Not exactly. Volatility measures how much a price swings. FINRA links bigger swings to higher potential risk [1], but how much you can lose also depends on your position size, any leverage and how long you hold.
What is the VIX?
FINRA describes the VIX as a measure of the expected volatility of US stocks, based on investors' expectations of major market moves [2]. It covers US stocks only.
Is crypto more volatile than other markets?
The CFTC describes virtual currencies as more volatile than traditional currencies [7]. Our sources give no single figure comparing crypto with stocks, so treat any such number you see with care.
The bottom line#
Volatility is the size and speed of price swings. It does not tell you which way a price will go, but it tells you how much a normal day can cost, and equal ups and downs leave you with less than you started with. Check the calendar for big releases, size positions for real swings, and read the risk disclosure before using leverage. For how volatility looks over months and years, see bull vs bear market.
Sources
- Volatility | FINRA.org.
- Key Terms for Tough Times: The Vocabulary of Stressed Markets.
- Downside financial risk is misunderstood.
- Price Formation and Liquidity in the U.S. Treasury Market: Evidence from Intraday Patterns Around Announcements (Staff Report No. 27).
- OTC foreign exchange turnover in April 2025.
- Stop Orders: Factors to Consider During Volatile Markets.
- Customer Advisory: Understand the Risks of Virtual Currency Trading.
Education only. This page is not investment, tax or legal advice. Trading and crypto can lose you money. See our risk disclosure.