Free trading calculators that show their maths
Each calculator runs in your browser, shows the formula it uses and includes a worked example you can check by hand.
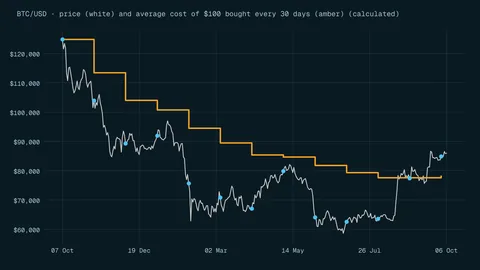
DCA calculator
Enter a fixed amount and the price on each purchase date to see units bought and your average cost. Formula, worked example and the limits of DCA.
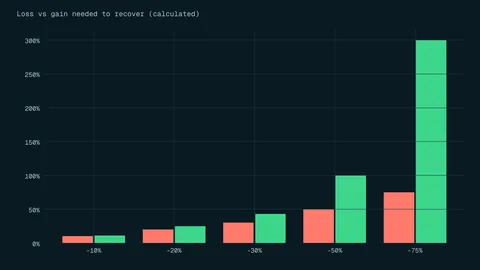
Drawdown recovery calculator
Enter a loss from your peak and see the gain needed to get back, plus a time estimate at a return you choose. Formula and a table you can check.
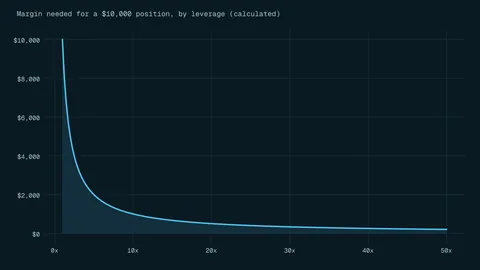
Margin calculator
Enter a position size and leverage to see the margin required, the price move that wipes out that margin and the loss at a move you choose.

Position size calculator
Work out how many units to trade from your account size, risk percentage, entry and stop. Shows the formula and a worked example you can check.
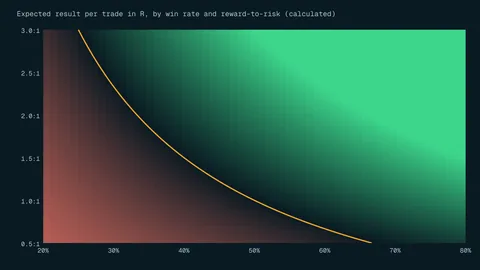
Risk reward calculator
Enter entry, stop, target and your measured win rate to see the reward-to-risk ratio, the win rate needed to break even and the average result per trade.
Trading cost calculator
Add up the spread, commission and overnight financing on one trade before you place it. Shows the formula and a worked example that matches the defaults.
Which calculator should you use?
- Before a trade: the position size calculator works out how many units to trade from your account size, risk percentage and stop, and the risk/reward calculator shows the win rate you would need to break even.
- With leverage: the leverage and margin calculator shows the margin a position needs and the price move that would wipe it out.
- After a losing run: the drawdown recovery calculator shows the gain needed to get back to your peak.
- For costs: the trading cost calculator adds up spread, commission and overnight financing on one trade. The SEC's fee bulletin shows how even small ongoing fees reduce a portfolio over twenty years [1].
- For regular buying: the DCA calculator. FINRA notes that dollar-cost averaging has lower risk but often lower returns than investing a lump sum, and may cost more in fees [2].
How should you read the results?
Every calculator shows its formula and a worked example, so you can check it by hand. The results depend entirely on what you type in, so use the prices, spreads and fees your broker actually quotes. A calculator cannot tell you whether a trade is a good idea, and none of them predicts prices.