Calculator
Drawdown recovery calculator
Enter how far your account has fallen from its peak. The calculator shows the gain you need just to get back to where you were, and how many years that takes at a yearly return you assume.
Quick answer
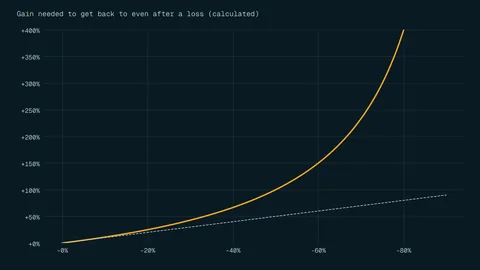
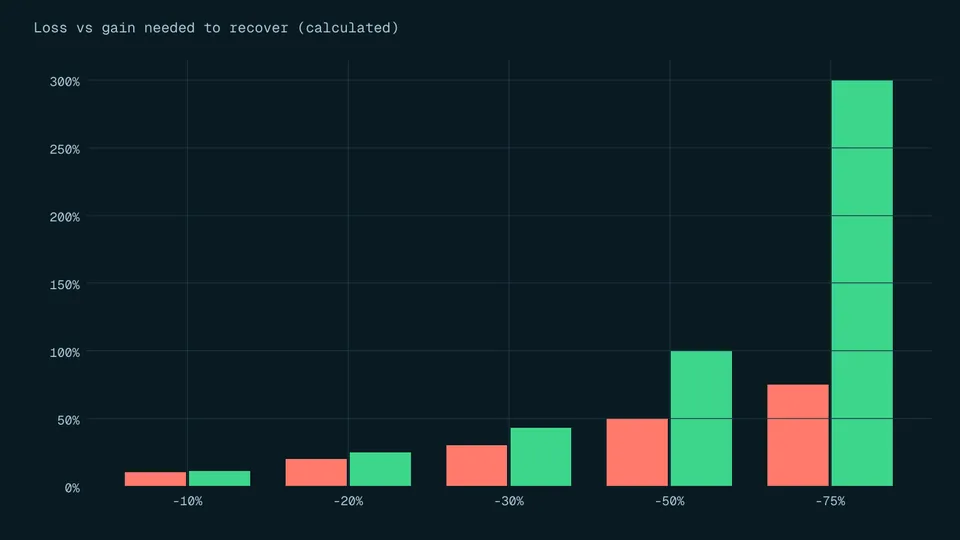
Gain needed = loss / (1 - loss). A 50% loss needs a 100% gain to break even [1]. At an assumed 7% a year, getting back from a 50% loss takes about 10.2 years (calculated). The 7% is an input you choose, not a forecast.
This calculator needs JavaScript. The formula and a worked example below show the same calculation by hand.
Key points
- Recovery needs a bigger percentage gain than the loss, because the gain starts from a smaller base [1].
- The gap grows fast: a 20% loss needs 25%, a 50% loss needs 100%, a 75% loss needs 300% (calculated).
- The time estimate assumes a steady yearly return. Real returns are uneven and can be negative.
On this page
How does the calculator work?#
A drawdown is how far an account has fallen from its highest value. After a loss, any gain is earned on a smaller amount, so it has to be a larger percentage to put the money back. The calculator applies that arithmetic directly.
gain needed = loss / (1 - loss)
For the time estimate, it asks how many years of a steady yearly return it would take to multiply what is left back up to the peak. The yearly return is your assumption. We do not suggest a figure, and none of our sources says what return anyone should expect.
years = ln(1 / (1 - loss)) / ln(1 + yearly return)
Can you check the result by hand?#
| Loss from peak | Gain needed | Years at 7% |
|---|---|---|
| 10% | 11.11% | 1.6 |
| 20% | 25% | 3.3 |
| 30% | 42.86% | 5.3 |
| 40% | 66.67% | 7.6 |
| 50% | 100% | 10.2 |
| 60% | 150% | 13.5 |
| 75% | 300% | 20.5 |
| 90% | 900% | 34 |
7% is the calculator's default input, used only as an example. Change it and the years change: the same 50% loss takes about 14.2 years at 5% and about 7.3 years at 10% (calculated).
Why do equal gains and losses not cancel out?#
Because percentages compound. Newall's paper on downside risk gives the example of a $100 stock that rises 50% to $150 and then falls 50% to $75, and notes that a sequence of +x% and -x% always leaves you behind, whichever comes first [1]. The same holds for smaller moves: +10% then -10% leaves $99 of every $100, and +20% then -20% leaves $96 (calculated).
Many people get this wrong. In the paper's first experiment with 981 US adults, 50.8% answered both downside-risk questions incorrectly [1]. The calculator is a quick way to check your intuition before a loss tests it for real.
What does the calculator not account for?#
- Uneven returns. The time estimate assumes the same return every year. Real returns vary and include losing years, which push recovery further out.
- The return is a guess. The yearly figure is an input, not a prediction. No calculator can tell you what a market will return.
- Costs and taxes. Fees, spreads and taxes reduce every gain, so the real recovery takes longer.
- Deposits and withdrawals. Adding money changes the account value but not the performance needed to recover the loss on what you had.
- Taking more risk to catch up. Trying to recover faster with bigger positions makes a larger drawdown more likely, not less.
How can you keep drawdowns small enough to recover from?#
Limit what any single trade can cost. With position sizing you decide the loss before you enter, so a run of losing trades takes a small, known share of the account instead of a large one. The NFA describes the money you should trade with as risk capital: money over and above what you need for necessities, emergencies, savings and long-term goals [3].
For the full explanation, with losing-streak tables and recovery times, read drawdown recovery: why a 50% loss needs a 100% gain. The risk reward ratio page shows how often long losing streaks happen at different win rates.
Frequently asked questions#
Why does a 50% loss need a 100% gain?
After losing half, you have half the money left. Doubling that half, a 100% gain, is what brings you back to the start [1].
What yearly return should I enter?
Whatever you want to test. We do not suggest a number, because no source we use gives an expected return. Try several values, including low ones, to see how sensitive the time is.
Does this include losing years during the recovery?
No. It assumes a steady return every year. Any losing year along the way means the recovery takes longer than shown.
Is a drawdown the same as a loss?
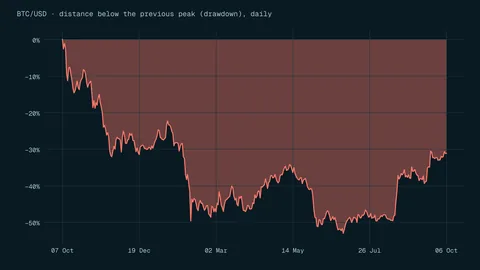
A drawdown is the fall from the account's highest value to its current value. It counts losses you have not closed yet as well as closed ones, so it can be larger than any single trade's loss.
The bottom line#
Use the calculator to see what a loss really costs before it happens. The bigger the drawdown, the faster the gain needed grows, and the time estimate is only as good as the return you assume. Keep each trade's loss small with position sizing, see the other risk management explainers, and read the risk disclosure before trading.
Sources
Education only. This page is not investment, tax or legal advice. Trading and crypto can lose you money. See our risk disclosure.