Explainer · Risk Management
Risk/reward ratio and win rate, together
A 3:1 risk/reward ratio sounds safe and an 80% win rate sounds impressive, but neither number tells you anything on its own. This page shows how the two fit together, with every example calculated in code.
Quick answer
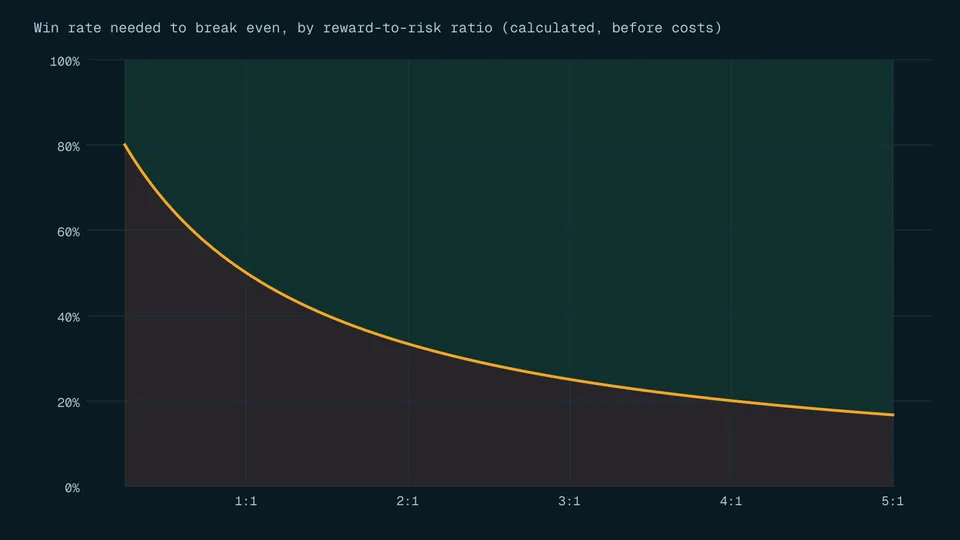
The risk/reward ratio compares what a trade can gain with what it can lose. The win rate is how often you win. Together they set your break-even point: at 2:1 you must win more than 33.3% of trades (calculated) before costs, which push that bar higher [1].
Key points
- Risk/reward = (target - entry) / (entry - stop). It describes one trade plan, not your skill.
- Break-even win rate = 1 / (1 + ratio). At 2:1 that is 33.3%, at 1:1 it is 50% (calculated).
- Expectancy combines both: (win rate × ratio) - loss rate, measured in units of risk (R).
- Costs and stops that fill below their price lower the real ratio, so the bar moves up [4].
- Official studies found most retail forex and CFD accounts lost money: 89% over four years (2009 to 2012) in a French AMF study [6].
On this page
What is a risk/reward ratio?#
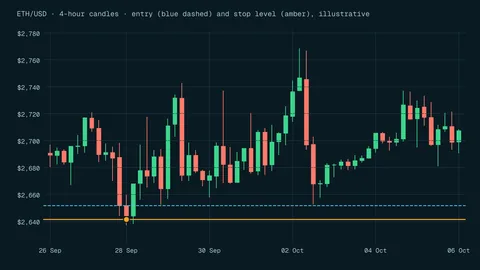
Before you open a trade you can write down three prices: where you get in (entry), where you will admit you were wrong (stop), and where you plan to take profit (target). The distance from entry to stop is your risk per unit. The distance from entry to target is your planned reward per unit. The risk/reward ratio simply divides one by the other.
Traders write it both ways round. "2:1 reward to risk" and "1:2 risk to reward" describe the same plan: you aim to make twice what you are prepared to lose. On this site we always put reward first, so a bigger number means a bigger target relative to the stop.
reward-to-risk ratio = |target - entry| / |entry - stop|
- Entry
- $100worked example
- Stop
- $95risk $5 per unit, calculated
- Target
- $110reward $10 per unit, calculated
- Ratio
- 2 : 1$10 / $5, calculated
Why does the ratio mean nothing without a win rate?#
A ratio tells you the size of a typical win compared with a typical loss. It says nothing about how often each happens. A 3:1 plan that only wins one trade in five loses money. A 1:1 plan that wins six trades in ten does not.
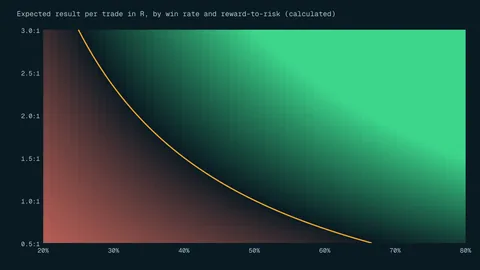
The link between the two is the break-even win rate: the share of trades you must win so that wins and losses cancel out. If each win is R times the size of each loss, you break even when win rate × R equals loss rate, which gives win rate = 1 / (1 + R).
| Reward to risk | Win needed to break even | Losses per 10 trades at break-even |
|---|---|---|
| 0.5 : 1 | 66.7% | 3.3 |
| 1 : 1 | 50% | 5 |
| 1.5 : 1 | 40% | 6 |
| 2 : 1 | 33.3% | 6.7 |
| 3 : 1 | 25% | 7.5 |
| 4 : 1 | 20% | 8 |
Break-even win rate = 1 / (1 + ratio). Real results also depend on costs and on stops filling at their price, which they may not.
The trade-off is real. A target far away gives a high ratio, but price has to travel further to reach it, so fewer trades get there. Moving the target out does not make a plan better; it changes which number you depend on.
How do you work out expectancy from both numbers?#
Expectancy is the average result per trade over many trades if your win rate and ratio stay the same. It is easiest to measure in R, where 1R is the amount you risk on one trade. A full loss costs 1R; a full win at 2:1 earns 2R.
expectancy (in R) = (win rate × ratio) - (1 - win rate)
- Measure your win rate from real records
Count closed trades in your journal or demo account. Wins divided by all trades. A guess or a hope does not count.
- Measure your average ratio
Use the average win and the average loss you actually got, not the targets and stops you planned.
- Apply the formula
Win rate 40% and ratio 2: (0.4 × 2) - 0.6 = 0.2R per trade (calculated).
- Turn R into money and subtract costs
If 1R is $100, 0.2R is $20 per trade on average before costs. Then take off spreads, commissions and financing, as shown in the next section.
| Win rate | Ratio 1 : 1 | Ratio 2 : 1 | Ratio 3 : 1 |
|---|---|---|---|
| 30% | -0.4R | -0.1R | +0.2R |
| 40% | -0.2R | +0.2R | +0.6R |
| 50% | 0R | +0.5R | +1.0R |
| 60% | +0.2R | +0.8R | +1.4R |
A positive number here is arithmetic on assumed inputs, not a forecast. Win rates measured on a few dozen trades are very uncertain, as the section on losing streaks shows.
How do costs and slippage change the break-even win rate?#
Every trade pays something: a spread, a commission, sometimes overnight financing. Costs come off your wins and add to your losses, so the real ratio is always smaller than the planned one. The SEC tells day traders to know up front how much they need to make to cover expenses and break even [1]. An undated CFTC advisory says that most US OTC forex customers lose money once all credits, financing charges, fees and other expenses are factored in [2].
In the example above, suppose the round trip costs $10 per trade. A win now nets $190 and a loss costs $110. The ratio drops from 2 to about 1.73, the break-even win rate rises from 33.3% to 36.7%, and the average result at a 40% win rate halves from $20 to $10 per trade (all calculated). Use the trading cost calculator to estimate your own costs.
Stops can also fill at a worse price than you set. When the stop price is reached, a stop order becomes a market order, and the price you get can deviate significantly from the stop [3]. FINRA states plainly that stop prices are not guaranteed execution prices [4]. If the $95 stop in our example filled at $93, the loss would be $7 per unit instead of $5, the real ratio would be about 1.43, and you would need to win 41.2% of trades to break even (calculated). Read more in our guide to the stop loss order.
Why can a high win rate still lose money?#
Because the size of the losses matters as much as how often they happen. Imagine a method that takes $25 profit quickly but lets losing trades run to $100. That is a ratio of 0.25:1, so it needs an 80% win rate just to break even. At a 75% win rate it loses about $625 over 100 trades, before any costs (calculated).
High win rates are comfortable because most days feel like progress. The danger is that one large loss can erase many small wins, which is why the size of the stop matters more than the streak of green trades before it.
Low win rates have a different danger: long losing streaks are normal, even when the plan has a positive expectancy on paper. If each trade is independent and you win 40% of the time, the chance of at least one run of 8 losses in a row somewhere in 100 trades is about 49%, and of 10 in a row about 20.5% (calculated by simulation and exact counting).
| Win rate | 5 losses in a row | 8 losses in a row | 10 losses in a row |
|---|---|---|---|
| 40% | 97.6% | 49% | 20.5% |
| 50% | 81% | 17% | 4.4% |
| 60% | 45.9% | 3.6% | 0.6% |
Assumes each trade is independent with a fixed win rate. Real trading is messier, so treat these as a floor on how rough a run can get.
This is where position sizing and the ratio meet. Ten losses at 5% risk each cost about 40% of an account, and the arithmetic of drawdown recovery means you would then need a gain of about 67% to get back (calculated) [5].
How reliable is a win rate from a few trades?#
Not very. Suppose you win 8 of your first 20 trades, a 40% win rate. A standard statistical range (a 95% Wilson interval) for the true win rate runs from about 21.9% to 61.3% (calculated). That range includes plans that lose money at 2:1 and plans that do well. After 100 trades at the same 40%, the range narrows to about 30.9% to 49.8%; after 500 trades, to about 35.8% to 44.4% (calculated).
So a short run of good results tells you little. Keep a journal, count every trade, and expect your estimate to keep moving.
- 20 trades
- 21.9% to 61.3%95% Wilson interval, calculated
- 100 trades
- 30.9% to 49.8%95% Wilson interval, calculated
- 500 trades
- 35.8% to 44.4%95% Wilson interval, calculated
What do official numbers say about retail traders?#
The numbers below describe accounts or traders, not single trades, so they are not win rates. They are still the best reality check a beginner can get.
A study published in 2014 by the French market regulator AMF, covering 14,799 active individual investors trading forex and CFDs from 2009 to 2012, found that 89% lost money over those four years, with an average loss of about €10,900 [6]. The same study found no learning curve: novices did not improve with experience [6]. ESMA's 2018 decision on CFDs cites separate national studies: 76% of accounts in Cyprus, about 82% in Spain, more than 89% in France and 75% in Ireland made a loss over the periods studied [7].
Research on day traders in Taiwan, covering 1992 to 2006, found that less than 1% of the day trader population could predictably and reliably earn positive abnormal returns net of fees [8]. A good-looking ratio on a trade plan does not change these odds; only a method with a real, measured edge after costs could.
Mistakes beginners make with risk/reward ratios#
- Quoting a ratio without a win rate
"I only take 3:1 trades" says nothing until you know how many of them reach the target. Always pair the ratio with a measured win rate.
- Moving the target to improve the ratio
Stretching the target from $110 to $120 turns 2:1 into 4:1 on paper, but fewer trades will get there. The win rate falls with it.
- Moving the stop after entry
Widening a stop to avoid being taken out makes the loss bigger and the real ratio smaller. Decide the stop before the trade and size from it.
- Ignoring costs and slippage
A plan that breaks even before costs loses money after them. Stops are not guaranteed prices [4].
- Trusting a short winning run
Twenty trades are not enough to know your win rate. The range of possible true win rates is still very wide.
Frequently asked questions#
What is a good risk/reward ratio?
There is no number that is good on its own. A ratio only works with the win rate you actually achieve. At 1:1 you need to win more than half your trades; at 3:1 you need more than a quarter, before costs (calculated).
Is 1:2 the same as 2:1?
Usually yes. "1:2 risk to reward" and "2:1 reward to risk" both mean the target is twice as far as the stop. Check which way round a source writes it before comparing numbers.
Does a higher ratio make a trade safer?
No. A higher ratio means a bigger target relative to the stop, which usually means a lower chance of reaching it. The money at risk on the trade is set by your stop and your position size, not by the target.
How many trades do I need before I know my win rate?
More than most people think. With 20 trades at a 40% win rate, the plausible true win rate still runs from about 22% to 61% (calculated). Hundreds of trades give a much tighter estimate, and markets can change in the meantime.
The bottom line#
A ratio tells you how big your wins are compared with your losses; a win rate tells you how often they happen. Only together, and after costs, do they say whether a method can even break even. Measure both from real records, plan with the worse numbers, and keep the risk on each trade small with position sizing. Most retail accounts in leveraged products lose money, so read our risk disclosure before you trade.
Sources
- Day Trading: Your Dollars at Risk.
- Customer Advisory: Eight Things You Should Know Before Trading Forex.
- Stop, Stop-Limit, and Trailing Stop Orders - Investor Bulletin.
- Stop Orders: Factors to Consider During Volatile Markets.
- Downside financial risk is misunderstood.
- Perspectives on the techniques used to market speculative trading on the Forex and binary options markets.
- European Securities and Markets Authority Decision (EU) 2018/796 of 22 May 2018 to temporarily restrict contracts for differences in the Union in accordance with Article 40 of Regulation (EU) No 600/2014.
- The cross-section of speculator skill: Evidence from day trading.
Education only. This page is not investment, tax or legal advice. Trading and crypto can lose you money. See our risk disclosure.