Explainer · Risk Management
Why a 50% loss needs a 100% gain
Losses and gains are not symmetrical. Every loss shrinks the base that the next gain works on, so the deeper the fall, the harder the climb back.
Quick answer
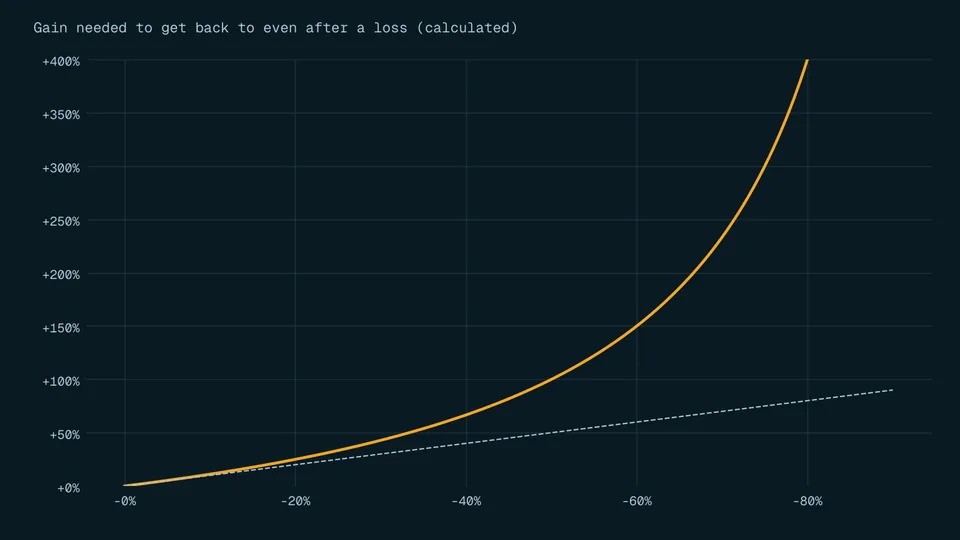
After a loss, your next gain starts from a smaller amount. Lose 50% and $10,000 becomes $5,000; you need to gain $5,000, which is 100% of what is left [2]. The gain needed is loss / (1 - loss), so it rises much faster than the loss.
Key points
- A 50% loss requires a 100% gain just to break even [2].
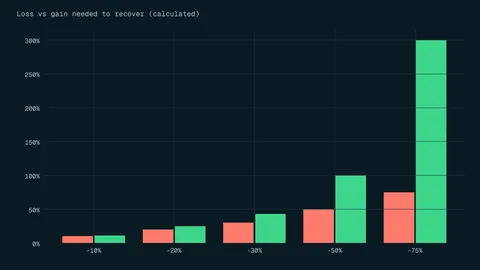
- Gain needed = loss / (1 - loss): 10% needs 11.11%, 30% needs 42.86%, 75% needs 300% (calculated).
- Equal percentage gains and losses leave you with less: +50% then -50% turns $100 into $75 [2].
- In one experiment with 981 US adults, 50.8% answered both downside-risk questions wrongly [2].
- The practical defence is keeping each loss small, not hoping for a big recovery.
On this page
What is a drawdown?#
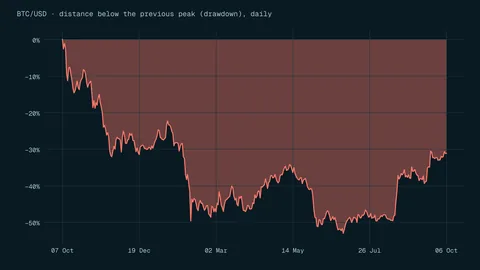
A drawdown is how far an account or investment has fallen from its highest point, usually shown as a percentage. If your account peaked at $10,000 and is now $8,000, you are in a 20% drawdown (calculated). It stays a drawdown until the account gets back above the old peak.
Drawdown recovery is the gain you need to return to that peak. This page is about the arithmetic that links the two, because the link is not what most people expect. Our glossary has a short entry on drawdown.
Why does a 50% loss need a 100% gain?#
Because percentages are always measured from where you are now, not from where you started. Philip Newall states it directly in a 2016 paper in Judgment and Decision Making: a 50% loss requires a subsequent 100% gain to break even [2].
The loss is measured against the old, larger balance. The gain is measured against the new, smaller one. The same number of dollars is a bigger percentage of a smaller base.
gain needed = loss / (1 - loss) (both as decimals: 0.5 / 0.5 = 1, so 100%)
How much gain does each loss need to recover?#
| Loss from peak | $10,000 becomes | Gain needed to recover |
|---|---|---|
| 5% | $9,500 | 5.26% |
| 10% | $9,000 | 11.11% |
| 20% | $8,000 | 25.00% |
| 25% | $7,500 | 33.33% |
| 30% | $7,000 | 42.86% |
| 40% | $6,000 | 66.67% |
| 50% | $5,000 | 100.00% |
| 60% | $4,000 | 150.00% |
| 75% | $2,500 | 300.00% |
| 90% | $1,000 | 900.00% |
Only the 50% row is stated in our source [2]. The others use gain = loss / (1 - loss). Costs and fees make every recovery harder.
The pattern is the point. Up to about 10%, the gain needed is only a little bigger than the loss: 5% needs 5.26% and 10% needs 11.11% (calculated). Past 30% the gap widens quickly, and past 50% it explodes: a 60% loss needs 150% and a 90% loss needs 900% (calculated). Small losses are cheap to repair. Large ones may never be repaired.
Why do equal ups and downs leave you behind?#
Newall's paper makes a second point that surprises people: a gain of x% followed by a loss of x%, or the other way round, always leaves you with less than you started with, whichever comes first [2]. His example: with returns of +50% and -50%, a $100 stock rises to $150 and then falls to $75 [2].
The bigger the swings, the bigger the shortfall. That is one reason volatile markets, and leverage, which magnifies swings [3], are harder on an account than the average move suggests.
- +10%, then -10%
- $99calculated
- +20%, then -20%
- $96calculated
- +30%, then -30%
- $91calculated
- +50%, then -50%
- $75Newall's example [2]
If this feels counterintuitive, you are in large company. In Newall's first experiment, 981 US adults answered questions about downside risk; 50.8% got both wrong and only 33.9% got both right [2]. People with higher numeracy and financial literacy scores did much better [2], which is a good argument for writing the numbers down instead of trusting a feeling. The paper also suggests that showing a run of percentage changes as one combined change should make the result easier to understand [2].
How long can a drawdown recovery take?#
No source we cite measures how long real recoveries take, and nobody can tell you what return you will earn. What arithmetic can show is how the time grows with the size of the loss if returns were steady. The table assumes a constant 7% a year purely to make the comparison; it is the default in our drawdown recovery calculator, not a forecast or a typical result.
| Loss from peak | Gain needed | Years at 7% a year |
|---|---|---|
| 10% | 11.11% | 1.6 |
| 20% | 25.00% | 3.3 |
| 30% | 42.86% | 5.3 |
| 50% | 100.00% | 10.2 |
| 75% | 300.00% | 20.5 |
Years = ln(1 / (1 - loss)) / ln(1.07). Real returns are uneven and can be negative, so actual recovery can take longer or may not happen.
How do you keep drawdowns small enough to recover from?#
The table above has one clear message: avoid the bottom rows. You cannot control what the market does, but you can control how much each trade costs if it goes wrong and how many wrong trades it takes to do serious damage.
- Use only risk capital
Trade only money you can afford to lose, over and above what you need for necessities, emergencies, savings and long-term goals [4].
- Risk a small, fixed share per trade
Size each position so a losing trade costs a set percentage of the account. Our guide to position sizing shows how.
- Keep leverage low
Leverage multiplies losses as much as gains. See leverage and margin explained for how fast a small move can empty a deposit.
- Decide your exit in advance
A stop loss order can cap planned losses, though it is not a guaranteed price.
- Set a review point
Pick a drawdown at which you stop trading and review what went wrong before placing another order. Write it down while the account is at a peak.
| Risk per trade | Losses to reach a 20% drawdown | Losses to reach a 50% drawdown |
|---|---|---|
| 1% | 23 | 69 |
| 2% | 12 | 35 |
| 5% | 5 | 14 |
| 10% | 3 | 7 |
Each loss is a fixed share of the current account, so losses compound. Counts are rounded up to whole trades.
At 10% per trade, seven losses in a row are enough to halve the account, and then you need 100% just to get back (calculated). At 1% per trade, it takes 69 straight losses (calculated).
Stop-loss rules also have limits. Kaminski and Lo define them as policies that cut exposure after cumulative losses reach a threshold, and show that if prices follow a random walk such a rule always lowers expected return [5]. A rule that stops you out protects the account from deeper drawdowns; it does not make the losses disappear.
Mistakes beginners make with drawdowns#
- Adding and subtracting percentages
Thinking a 20% loss is undone by a 20% gain. From $10,000, -20% then +20% leaves $9,600 (calculated).
- Raising the stakes to recover faster
Bigger positions after a loss make the next loss bigger too, and push the account further down the recovery table.
- Judging a strategy only by its average return
Two approaches with the same average can have very different worst falls. Look at the largest drawdown as well.
- Ignoring costs during the climb back
Fees and financing come out of every trade. The SEC advises day traders to know in advance how much they need to make just to cover expenses and break even [6].
- Assuming experience fixes it
In a French study of retail forex and CFD clients, novices showed no learning curve over time, and the most active traders saw their losses grow [7].
Frequently asked questions#
What is the formula for drawdown recovery?
Gain needed = loss / (1 - loss), with both as decimals. A 25% loss needs 0.25 / 0.75 = 33.33% (calculated). The 50% case, which needs 100%, is the example in Newall (2016) [2].
Is a 20% drawdown bad?
It needs a 25% gain to recover (calculated), which is manageable compared with deeper losses. Whether it is acceptable depends on how much of your money you planned to put at risk in the first place.
Does it matter whether the gain or the loss comes first?
No. A gain and a loss of the same percentage leave you with less than you started with, in either order [2].
Can I recover a 90% loss?
It would take a 900% gain from what is left (calculated). Treat a loss that deep as something to prevent through position sizing and low leverage, not something to plan on recovering from.
The bottom line#
A loss and the gain needed to undo it are not the same size, and the gap grows fast: 10% needs 11.11%, 50% needs 100%, 75% needs 300%. That arithmetic is why risk control comes before any strategy. Keep each loss small with position sizing, check your own numbers in the drawdown recovery calculator, and read the risk disclosure before trading.
Sources
- 17 CFR 4.10 -- Definitions..
- Downside financial risk is misunderstood.
- Customer Advisory: Eight Things You Should Know Before Trading Forex.
- Investor Best Practices | NFA.
- When Do Stop-Loss Rules Stop Losses?.
- Day Trading: Your Dollars at Risk.
- Perspectives on the techniques used to market speculative trading on the Forex and binary options markets.
Education only. This page is not investment, tax or legal advice. Trading and crypto can lose you money. See our risk disclosure.