Glossary
Drawdown: how far an account falls from its peak
A drawdown measures the pain, not the result. An account can be up since you started and still be deep in a drawdown, and every percentage point of it takes more than one point of gain to win back.
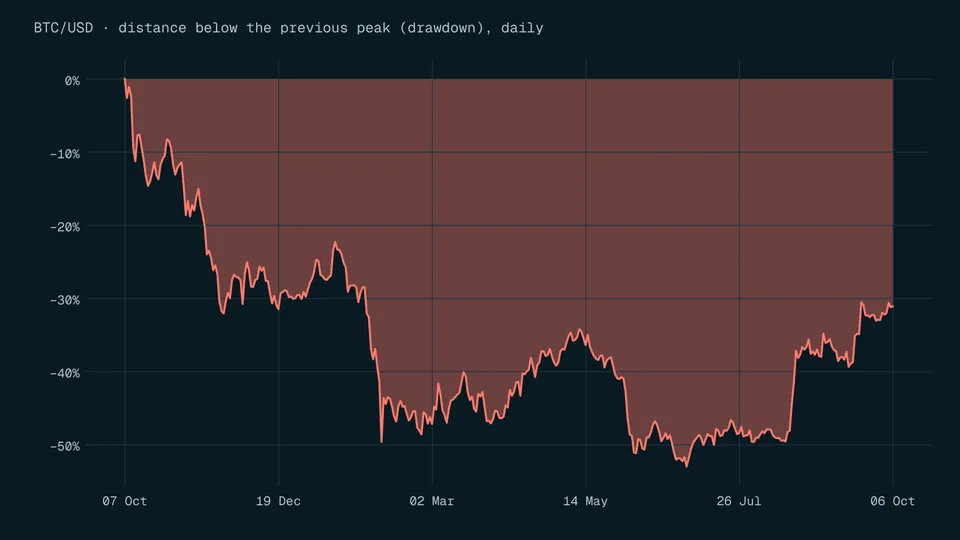
A drawdown is the decline in an account's value from its highest point (the peak) to a later low point, usually stated as a percentage of the peak. It lasts until the account climbs back above that peak.
Quick answer
A drawdown is how far an account has fallen from its highest value, as a percentage of that peak. US commodity rules define the worst peak-to-valley drawdown the same way, using month-end values [1]. Recovery is harder than the fall: a 50% loss needs a 100% gain to break even [2].
Key points
- Drawdown % = (peak value - current value) / peak value x 100, measured from the highest point, not from your deposit.
- The CFTC defines the worst peak-to-valley drawdown as the greatest cumulative percentage fall from a peak that has not yet been regained [1].
- Gain needed to recover = loss / (1 - loss): a 25% drawdown needs a 33.33% gain (calculated) [2].
On this page
What is a drawdown?#
The plainest official definition comes from US commodity regulation: a draw-down means losses experienced by a pool or account over a specified period [1]. The same rules define the worst peak-to-valley draw-down as the greatest cumulative percentage decline in month-end value due to losses, during a period in which the earlier high was not equaled or exceeded, and require it to be stated as a percentage of that earlier high [1].
Those definitions are written for professional fund and advisor disclosures, but the idea works for any account. Start at the highest value the account has reached, measure the fall to the lowest point after it, and express that fall as a share of the peak. The drawdown ends only when the account makes a new high.
drawdown % = (peak value - lowest value since the peak) / peak value x 100
How do you measure a drawdown over time?#
Track the running peak, the highest value so far, and compare each new value with it. The table follows month-end values, the same basis the CFTC definition uses [1].
| Month end | Account value | Highest value so far | Drawdown from peak |
|---|---|---|---|
| Month 1 | $10,000 | $10,000 | 0% |
| Month 2 | $11,000 | $11,000 | 0% |
| Month 3 | $12,000 | $12,000 | 0% |
| Month 4 | $10,800 | $12,000 | 10% |
| Month 5 | $9,000 | $12,000 | 25% |
| Month 6 | $9,900 | $12,000 | 17.5% |
| Month 7 | $12,300 | $12,300 | 0% |
Illustrative account values. Drawdowns calculated. The worst drawdown here is 25%, from month 3 to month 5, and it ends in month 7 when the account passes its old peak.
Notice month 6. The account rose 10% from the low, yet it was still in a 17.5% drawdown (calculated). A rally after a fall is not a recovery until the old peak is passed.
Why does a drawdown take more gain to recover?#
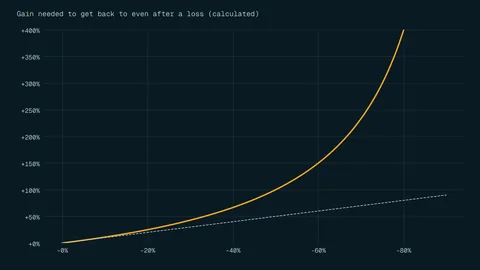
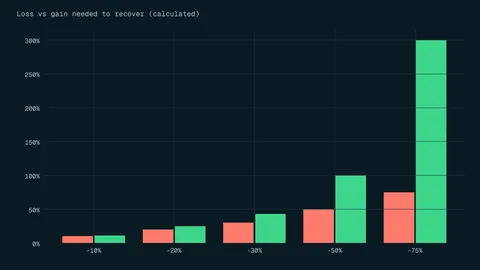
Because the gain is calculated on a smaller amount. Research on downside risk puts it simply: a 50% loss requires a subsequent 100% gain to break even, and a sequence of +x% and -x% always leaves you with a net loss, whichever comes first [2]. In the same study, 50.8% of 981 US adults answered both downside-risk questions incorrectly [2], so this is easy to get wrong.
| Drawdown | Gain needed to get back to the peak |
|---|---|
| 10% | 11.11% |
| 20% | 25% |
| 25% | 33.33% |
| 30% | 42.86% |
| 50% | 100% |
| 75% | 300% |
| 90% | 900% |
Calculated with gain needed = loss / (1 - loss). The 50% row matches the example in Newall (2016) [2].
The table is the case for keeping drawdowns small. Small, fixed losses per trade keep drawdowns in the part of the table where recovery is realistic; our guide to position sizing shows how, and a stop-loss helps by defining where each trade ends. For the full arithmetic see why a 50% loss needs a 100% gain, or test your own numbers in the drawdown recovery calculator.
Frequently asked questions#
Is a drawdown the same as a loss?
Not quite. A loss is measured from what you paid or deposited. A drawdown is measured from the highest value the account reached, so you can be in a drawdown while still above your starting amount, as in the worked example above.
What is maximum drawdown?
It is the largest peak-to-trough fall over a period. US commodity rules call it the worst peak-to-valley draw-down and require it as a percentage of the earlier peak, with the months and years it covered [1].
What drawdown is acceptable?
Our sources set no acceptable level. A useful test is the recovery table: decide in advance the largest drawdown you could live with, financially and emotionally, and size your trades so that a normal losing streak stays well inside it.
The bottom line#
A drawdown measures how far you have fallen from your best point, and every step down takes a bigger step up to undo. Measure it from the peak, keep it small with consistent position sizes, and trade only money you can afford to lose. Read the risk disclosure before trading.
Sources
Education only. This page is not investment, tax or legal advice. Trading and crypto can lose you money. See our risk disclosure.