Glossary
Liquidity: how easily you can buy or sell
Liquidity is the part of a trade you only notice when it is missing. It decides how much it costs to get in, and whether you can get out when you want to.
Liquidity is how easily and quickly something can be bought or sold without paying a hefty cost or moving its price much. In a liquid market you can get in and out fast, close to the quoted price; in an illiquid one you may not be able to.
Quick answer
Liquidity is how easily or quickly you can buy or sell something [1]. In a liquid market you can trade quickly without significantly moving the price [2]. Low liquidity can make an asset hard to sell, and the SEC warns it may mean a bigger loss [1].
Key points
- The SEC: liquidity generally refers to how easily or quickly a security can be bought or sold in a secondary market [1].
- Liquidity risk is the risk that you will not find a market for what you want to sell [1].
- Liquidity can thin out at the worst moment: in a study of the US Treasury market, trading volume was notably low right at major announcements, when prices were most volatile [6].
On this page
What does liquidity mean in trading?#
The SEC's definition is short: liquidity generally refers to how easily or quickly a security can be bought or sold in a secondary market [1]. Liquid investments can be sold readily, without paying a hefty fee, when you need the money [1]. For a stock, the SEC says liquidity is about how rapidly shares can be bought or sold without substantially affecting the stock price [1].
FINRA describes the same idea for whole markets: a market has liquidity when participants can quickly buy and sell without significantly affecting prices [2]. Put simply, liquidity has two parts, speed and price. You want to trade when you choose, and at a price close to the one on your screen.
You will also see the word used about central banks. After the October 1987 crash, the Fed affirmed its readiness to serve as a source of liquidity to support the economic and financial system [3]. That means supplying money to the financial system, a related but different meaning from the trading one on this page.
What does low liquidity cost you?#
The first cost is getting out. The SEC warns that stocks with low liquidity may be difficult to sell and may cause you to take a bigger loss if you cannot sell the shares when you want to [1]. It calls this liquidity risk, the risk that investors will not find a market for their securities, and notes it can also apply to products that charge a penalty for early withdrawal, such as a certificate of deposit (CD) [1].
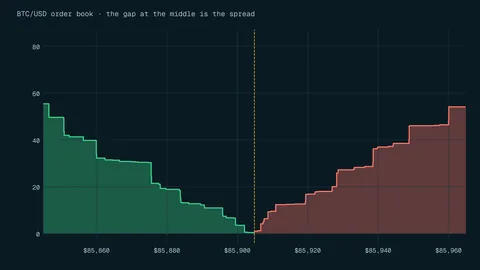
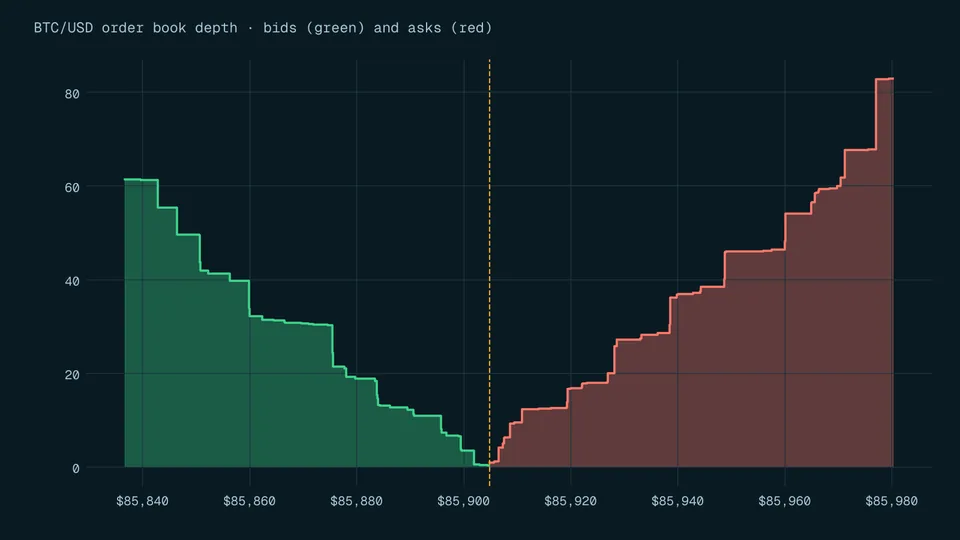
The second cost is the gap between the price you can buy at and the price you can sell at, the bid ask spread. The table uses made-up quotes to show how that gap adds up. Our sources give no typical spread sizes, so treat the figures as an illustration only.
| Stock (illustrative quotes) | Bid-ask spread | Cost of crossing it on 100 shares | As a share of a $20 price |
|---|---|---|---|
| Heavily traded stock | $0.02 | $2 | 0.1% |
| Thinly traded stock | $0.50 | $50 | 2.5% |
Illustrative quotes, not market data. All figures calculated.
The SEC adds that the price a market order executes at often deviates from the last-traded price or real-time quote, because of demand for the stock and the prices of available liquidity at that moment [4]. That effect is usually called slippage.
Can a huge market still run short of liquidity?#
Yes, for short periods. Take the currency market: the BIS found that trading averaged $9.6 trillion per day in April 2025, up 28% from $7.5 trillion three years earlier, with $3 trillion a day in spot trading [5]. But most of that is between banks and other financial institutions: trading between dealers made up 46% of the total and trading with other financial institutions 50% [5]. The headline figure does not tell you how liquid the price on your own platform will be.
Liquidity can also thin out at the moment it matters most. In the US Treasury market, researchers at the Federal Reserve Bank of New York found a notable lack of trading volume right at major announcements, when prices were most volatile; volume surged only after a lag, and the bid-ask spread widened dramatically with volatility and narrowed again with volume [6]. That study covers only Treasury bonds, so treat it as a warning for other markets, not as a rule. See volatility, check the economic calendar before you trade, and read trading volume for how volume and liquidity show up on a chart.
Frequently asked questions#
Is high liquidity always good for a trader?
It usually makes getting in and out cheaper and quicker, because you can trade without significantly moving the price [2]. It does not protect you from the price itself falling. A liquid asset can still lose value fast.
What is liquidity risk?
The SEC defines it as the risk that investors will not find a market for their securities [1]. In practice it means you may not be able to sell when you want, or only at a much lower price.
Are crypto markets liquid?
Our sources give no liquidity measure for crypto markets, so we cannot give you a figure. Before trading, look at the spread and the trading volume on the platform you use, and read our page on trading volume.
The bottom line#
Liquidity is how easily you can buy or sell without moving the price. When it is high, trading costs little and exits are quick; when it is low, spreads widen, orders can fill at worse prices, and selling can be hard exactly when you need to. Check the spread before every trade, be careful around big news, and read the risk disclosure before trading.
Sources
- Liquidity (or Marketability) | Investor.gov.
- Key Terms for Tough Times: The Vocabulary of Stressed Markets.
- Stock Market Crash of 1987.
- Understanding Order Types (Investor Bulletin).
- OTC foreign exchange turnover in April 2025.
- Price Formation and Liquidity in the U.S. Treasury Market: Evidence from Intraday Patterns Around Announcements (Staff Report No. 27).
Education only. This page is not investment, tax or legal advice. Trading and crypto can lose you money. See our risk disclosure.