Explainer · Charts & Analysis
Volume and liquidity: why they matter for every trade
Volume tells you how much traded. Liquidity tells you how easily you can get in and out without moving the price against yourself. Beginners watch the price and ignore both, then wonder why their fills are worse than the chart.
Quick answer
Trading volume is how much of something changed hands in a period [1]. Liquidity is how easily you can buy or sell without moving the price [4]. Higher volume usually means better liquidity [6], and thin markets usually cost more to trade [2].
Key points
- Volume counts what traded; the CFTC defines it as the number of contracts traded in a set period [1].
- Liquidity is about ease and price impact, not just activity [4].
- In U.S. stock data, lower-volume stocks tend to have higher transaction costs and wider quoted spreads [2].
- A triggered stop becomes a market order and fills at whatever liquidity is there, so thin markets can turn a planned loss into a bigger one [8].
- Reported volume is not always real: a study of unregulated crypto exchanges found wash trading averaged more than 70% of reported volume [10].
On this page
What is trading volume?#
Trading volume is a count. The CFTC's glossary defines volume as the number of contracts traded during a specified period of time [1]. For a stock, the same idea is counted in shares: an SEC staff paper measures stocks by their average daily trading volume, the number of shares that trade on a typical day [2]. If your chart shows volume, each bar is that count for one candle or period.
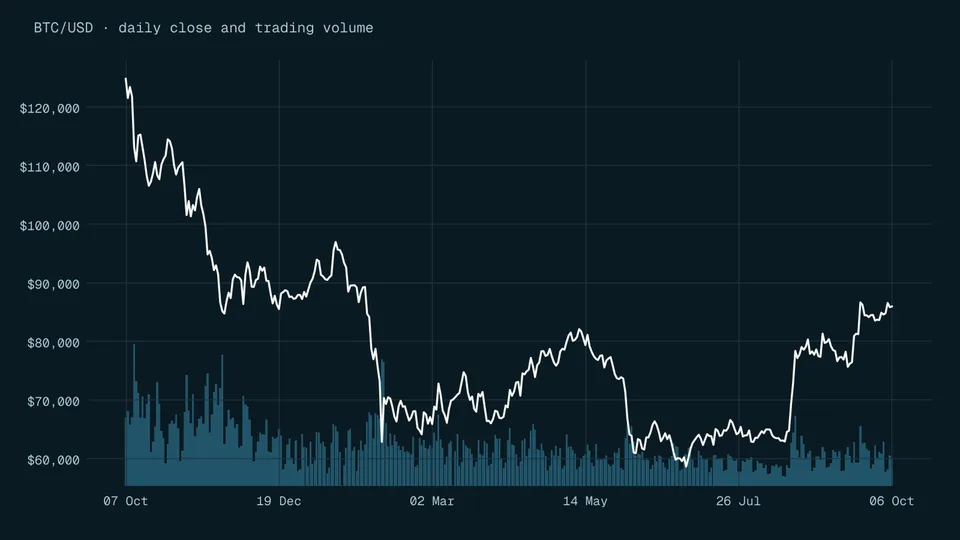
Volume is one of the inputs of chart reading. The St. Louis Fed describes technical analysis as the use of past prices and/or other market data, such as volume, to guide trading decisions [3]. On its own, though, a volume number does not tell you which way the price will go. It tells you how many people were active, and that matters mostly for one practical question: can you trade at a fair price when you need to?
How is liquidity different from volume?#
Liquidity is about ease, not activity. The SEC says liquidity generally refers to how easily or quickly a security can be bought or sold, and for a stock, how rapidly shares can be traded without substantially impacting the price [4]. The CFTC puts it the same way: a liquid market is one where buying and selling can be done with minimal effect on price [5].
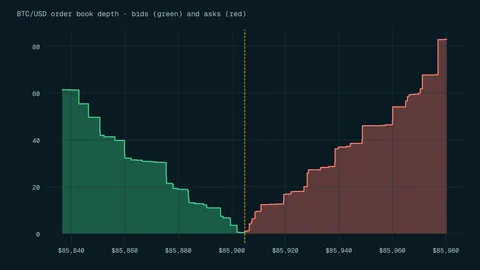
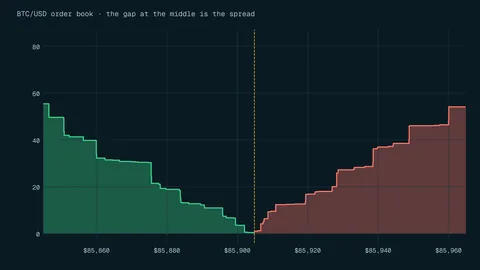
The two are linked. FINRA says that securities with higher trading volume are generally more liquid, and that illiquid investments often have a wide bid-ask spread [6]. But they are not the same thing. A burst of volume on news can arrive while the spread is wide, and a narrow spread alone does not give the full picture either [6]. Our glossary entry on liquidity has the short version.
The table puts the three words you will see most often side by side.
| Term | What it measures | What it does not tell you |
|---|---|---|
| Volume | How much traded in a period (contracts, shares or coins) | Whether the price will rise or fall, or whether the number is real |
| Liquidity | How easily you can trade without moving the price | A fixed level; it can change with the time of day and with market stress |
| Bid-ask spread | The gap between the best price to sell and the best price to buy | How much you can trade at that price before it moves |
Definitions from the CFTC and SEC [1] [4]; FINRA notes a narrow spread is not a complete picture on its own [6].
Why do thin markets cost you more?#
Many listed stocks trade far less than beginners expect. An SEC staff paper on thinly traded securities reported that approximately one-half of all U.S. NMS stocks had average daily volume under 100,000 shares, and together they made up less than two percent of daily share volume [2]. Among corporate common stocks in the fourth quarter of 2017, 1,301 of 4,656 traded under 100,000 shares a day [2], about 27.9% (calculated).
The same paper says the research has consistently found that stocks with lower trading volume tend to have higher transaction costs, and that quoted spreads were greater for stocks trading under 100,000 shares a day than for busier ones [2]. FINRA adds that a large spread raises the price you pay and lowers the price you get [6]. You pay that cost every time you enter and exit, whether the trade wins or loses. Our guide to the bid-ask spread explains where it comes from.
What happens to your order when liquidity is thin?#
The price on your chart is the last trade, not a promise. The SEC points out that the last-traded price is not necessarily the price at which a market order will be executed, and that a market order guarantees execution but not price [7]. A stop order works the same way once it is hit: it becomes a market order [7], and the SEC warns the fill can deviate significantly from the stop price because of the prices of available liquidity at that moment [8]. The gap between the price you expected and the price you got is called slippage.
Here is what that looks like with invented numbers. You want to sell 1,000 shares at market. The buyers waiting are 300 shares at $10.00, 400 at $9.95 and 300 at $9.80. Your order takes all three levels.
- Price on the chart
- $10.00worked example, invented prices
- Average fill
- $9.92(300 x 10.00 + 400 x 9.95 + 300 x 9.80) / 1,000, calculated
- Money received
- $9,920calculated
- Shortfall
- $800.8% below the chart price, calculated
If that sale was a stop-loss, your planned loss just grew by $80 before costs. This is why our page on stop-loss orders treats the stop price as a trigger, not a guaranteed exit.
When does liquidity dry up?#
Liquidity is not fixed. FINRA notes that in crises or volatile markets, illiquid investments might become even less liquid, and that extended-hours sessions can offer less liquidity because fewer buyers and sellers are active outside regular hours [6].
Big scheduled news is another moment to be careful. A New York Fed study of the U.S. Treasury market in the 1990s found a notable lack of trading volume right after a major announcement, exactly when prices were most volatile, with volume surging only after a lag [9]. The same study found the bid-ask spread widens dramatically with volatility and narrows with volume [9]. That study covers one market, so treat it as a warning sign, not a timetable. The economic calendar tells you when those releases are due.
Can you trust the volume number you see?#
Not always. In crypto, a peer-reviewed study of 29 centralized exchanges found that the regulated ones showed normal trading patterns, while wash trading on each unregulated exchange averaged more than 70% of reported volume [10]. The authors say fake volume improves exchange rankings and can temporarily distort prices [10]. Put simply, if an unregulated exchange reports $100 million of trading, the study's average implies less than $30 million of it was real (calculated). Our checklist on whether a crypto exchange is safe covers other warning signs.
Forex has a different problem: there is no single exchange, so there is no single volume figure. The BIS survey measured over-the-counter FX trading at $9.6 trillion per day in April 2025, but it notes that month came with elevated volatility and a surge in trading after trade-policy announcements [11]. That is dealer-reported turnover across the whole market, and the survey says nothing about the volume bars a broker's chart shows [11].
How do you check liquidity before a trade?#
- Look at the spread first
Compare the bid and the ask. A wide gap is a cost you pay on entry and exit, and FINRA says illiquid investments often have one [6].
- Compare your size with normal volume
If your order is large next to what usually trades, FINRA warns that executing a large order quickly in a low-volume security can be difficult [6].
- Size for a worse exit
Assume your stop can fill below its price and size the position so that loss is still affordable. Our position sizing guide shows the formula.
Mistakes beginners make with volume and liquidity#
- Reading volume as a buy or sell signal
Volume tells you activity, not direction. Nothing in the sources we cite shows that a volume spike predicts which way the price goes next.
- Trusting the chart price as your fill
The last trade is not your price. A market order fills at what is available [7].
- Treating exchange rankings as proof
On unregulated crypto exchanges, a large share of reported volume can be wash trading [10].
- Ignoring the spread on small trades
A 30-cent spread on a $20 stock costs about 1.49% of the mid price per round trip in our example (calculated). Repeat it often and it adds up.
- Trading the first seconds after big news
In the Treasury study, prices moved most while volume was thin [9]. Waiting for the spread to settle is a cheap precaution.
Frequently asked questions#
Is high trading volume good?
Does forex have trading volume?
Yes, but no single exchange reports it. The BIS survey measured $9.6 trillion a day in April 2025 across the over-the-counter market [11]. That figure says nothing about the volume shown on a broker's chart.
What is a thinly traded stock?
There is no official cut-off. The SEC staff paper we cite grouped stocks trading under 100,000 shares a day and found they tend to have wider quoted spreads and higher transaction costs [2].
The bottom line#
Before you look at a pattern on a chart, check whether you can actually trade it at a fair price. Look at the spread, compare your size with normal volume, avoid the thinnest moments, and size every position as if the exit could be worse than the chart shows. Volume and liquidity do not predict prices, but they decide what each trade really costs. Read the risk disclosure before trading.
Sources
- CFTC Glossary: A Guide to the Language of the Futures Industry (entries U-V).
- Division of Trading and Markets: Background Paper on the Market Structure for Thinly Traded Securities.
- Technical Analysis in the Foreign Exchange Market" (Federal Reserve Bank of St. Louis Working Paper 2011-001B).
- Liquidity (or Marketability)" (Investor.gov glossary).
- CFTC Glossary: A Guide to the Language of the Futures Industry (entries L).
- Understanding Market Liquidity and Your Investments.
- Types of Orders" (Investor.gov).
- Stop, Stop-Limit, and Trailing Stop Orders - Investor Bulletin.
- Price Formation and Liquidity in the U.S. Treasury Market: Evidence from Intraday Patterns Around Announcements (Staff Report No. 27).
- Crypto Wash Trading" (abstract, Management Science 69(11), 2023, pp. 6427-6454).
- OTC foreign exchange turnover in April 2025" (Triennial Central Bank Survey of Foreign Exchange and OTC Derivatives Markets).
Education only. This page is not investment, tax or legal advice. Trading and crypto can lose you money. See our risk disclosure.