Explainer · Charts & Analysis
Support and resistance, without the mysticism
Support and resistance are price levels where a move may stall. The evidence says they matter a little more than chance, and much less than chart lore suggests.
Quick answer
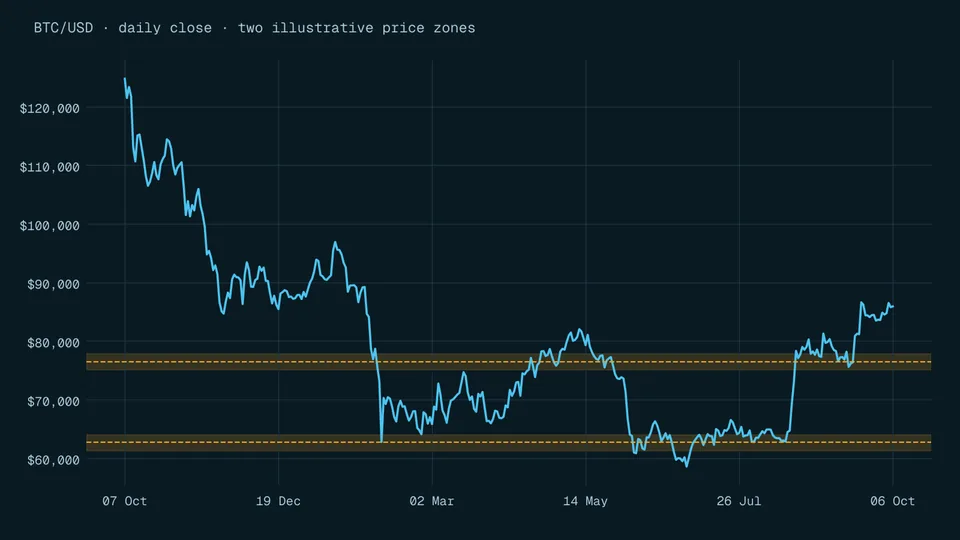
Support is a price where a falling move may stop; resistance is where a rising move may stop [1]. In a New York Fed study of currencies from 1996 to 1998, published levels interrupted trends 60.8% of the time, versus 56.2% for random levels [1]. Treat levels as zones, not floors.
Key points
- Support and resistance are points where a trend is likely to stop and may reverse, not walls [1].
- Random levels also stopped trends 56.2% of the time; published levels did 4.6 percentage points better (calculated from [1]).
- Stop-loss and take-profit orders cluster at round numbers, which helps explain why levels matter [2].
- When a level breaks, triggered stop orders become market orders and can fill well past your stop price [4].
- The evidence covers three currencies against the dollar in 1996 to 2000; nothing in our sources tests stocks or crypto.
On this page
What are support and resistance?#
A support level is a price below the market where a falling trend may stop. A resistance level is a price above the market where a rising trend may stop. A Federal Reserve Bank of New York paper puts it carefully: they are points at which a trend is likely to stop and may be reversed [1].
Notice the wording: likely to stop, may be reversed. Nothing in that definition says price must bounce. Traders draw these levels from earlier highs and lows on a chart, from round numbers, or from levels published by banks and analysts. Reading the candles that form those highs and lows is covered in how to read a candlestick chart.
Do support and resistance levels really work?#
The most careful public test we found is Carol Osler's study for the New York Fed. She took support and resistance levels published daily by six firms from January 1996 through March 1998, for the German mark, Japanese yen and British pound against the US dollar [1]. A level counted as a bounce if, fifteen minutes after price touched it, price was back on the side it came from. Then she compared the published levels with artificial levels chosen at random [1].
Published levels stopped intraday trends 60.8% of the time on average. Random levels stopped them 56.2% of the time [1]. Five days after publication the published levels were still ahead for every firm and currency, significantly so in 9 of 16 cases [1]. But the gap is small: 4.6 percentage points (calculated). Most of what looks like a level holding would have happened at a random price too.
| Question | Finding |
|---|---|
| Did published levels beat random ones? | Yes, 60.8% against 56.2% on average |
| Did the edge last five days? | Published levels still beat random ones for all firms and currencies; significant in 9 of 16 cases |
| Did levels several firms agreed on do better? | No better than levels from a single firm |
| Were the firms' strength ratings useful? | No, published strength estimates did not seem useful |
| Was trading the bounces profitable? | Not tested; the paper only raises the question |
All rows from [1]. Sample: six firms, three currencies against the US dollar, 1996 to 1998.
Why would prices pause at a level?#
A second New York Fed paper looked at the orders behind the price. Osler studied 9,667 stop-loss and take-profit orders at one large currency dealing bank between September 1, 1999 and April 11, 2000 [2]. The requested prices clustered, with especially strong clusters at round numbers [2].
The two kinds of order push in opposite directions. Take-profit orders tend to reflect trends, which can stop a move. Stop-loss orders tend to intensify trends, which can speed a move up once a level is crossed [2]. The earlier paper also lists clustered orders and self-fulfilling prophecies as possible explanations, and judges central bank intervention unlikely to be an important source [1].
Why do round numbers matter so much?#
Because people choose them. In the published levels Osler studied, more than 70% ended in 0 and a full 96% ended in 0 or 5 [1]. In the bank's order book, the single biggest cluster was at prices ending in 00, holding roughly 8.7% of orders [2].
The same paper found stop-loss buy orders clustered just above round numbers and stop-loss sell orders just below them [2]. The paper uses this to explain why a move can speed up after a level breaks: a crowd of stops sits on the far side [2].
How can a beginner mark a level without fooling themselves?#
The study's biggest lesson is that random levels also look like they work most of the time [1]. So the useful habit is not finding levels, it is checking whether your levels beat chance. A simple routine, for learning on past charts rather than for live trades:
- Mark a zone, not a line
Use a band around earlier turning points and note any round number inside it.
- Write down the rule before you look ahead
Decide what counts as a bounce (for example, price back on its original side after a fixed time), as the Fed study did [1].
- Mark some random levels too
Pick prices at random in the same range and apply the same rule to them.
- Count both
If your levels do not stop moves clearly more often than random ones, they are not adding information.
- Record it
Keep the results in a trading journal so memory does not flatter you.
What happens to your stop when a level breaks?#
If you place a stop-loss just past a support or resistance level, two facts from our sources matter. First, stop-loss sell orders already cluster just below round numbers [2], so your stop may sit in a crowd that triggers together. Second, when the stop price is reached, a stop order becomes a market order [3], and the SEC warns the fill can deviate significantly from the stop price because of the liquidity available at that moment [4].
A stop-limit order caps the price but may not execute at all if price moves away from the limit [4]. More on both in our guide to stop-loss orders.
Mistakes beginners make with support and resistance#
- Treating a level as a floor
Random levels stopped trends 56.2% of the time in the Fed study [1]. A bounce proves little on its own.
- Trusting a level because many people agree
Levels several firms agreed on did no better than single-firm levels, and strength ratings were not useful [1].
- Drawing levels after the move
Hindsight makes every turning point look obvious. Mark levels before you look at what came next.
- Stretching the evidence
The research covers three dollar exchange rates in 1996 to 2000. Our sources do not test stocks or crypto, so do not assume the same numbers apply.
Frequently asked questions#
What is the difference between support and resistance?
Support sits below the price, where a fall may stop. Resistance sits above it, where a rise may stop. Both are points where a trend is likely to stop and may reverse [1].
Do support and resistance work in crypto?
Our sources do not test crypto. The evidence we have covers currencies from 1996 to 2000 [1], so treat any claim about crypto levels with caution.
Why do levels often sit at round numbers?
People choose round numbers for their orders and forecasts. 96% of the levels in the New York Fed sample ended in 0 or 5 [1].
Is it profitable to buy at support and sell at resistance?
The New York Fed paper did not test profitability after costs; it only showed that published levels stopped trends somewhat more often than random ones [1].
The bottom line#
Support and resistance are a way of noting where orders tend to gather, often at round numbers. In the best public evidence they beat random levels by a few percentage points, not by enough to treat them as walls. Mark zones before you look ahead, test them against random prices, and plan your stop as if it will fill worse than its price. Then continue with moving averages, another way traders summarise price history.
Sources
- Support for Resistance: Technical Analysis and Intraday Exchange Rates.
- Currency Orders and Exchange-Rate Dynamics: Explaining the Success of Technical Analysis" (Federal Reserve Bank of New York Staff Reports, no. 125).
- Types of Orders" (Investor.gov).
- Stop, Stop-Limit, and Trailing Stop Orders - Investor Bulletin.
Education only. This page is not investment, tax or legal advice. Trading and crypto can lose you money. See our risk disclosure.