Explainer · Charts & Analysis
Moving averages explained
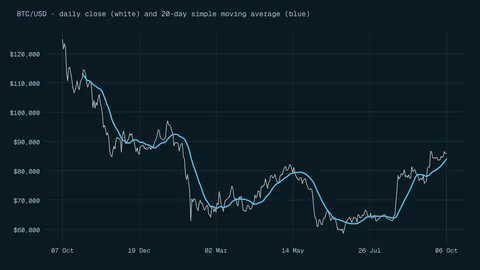
A moving average turns a jumpy price series into a smoother line. The price of that smoothness is delay, and the research on trading with it is less flattering than most charts suggest.
Quick answer
A moving average is the average of the last few prices, recalculated each period, so it smooths noise [1]. A simple one weighs each price equally; an exponential one gives recent prices more weight [3]. Both lag [1], and classic crossover rules had become unprofitable in currencies by the early 1990s [4].
Key points
- A moving average smooths a volatile series by averaging neighbouring data points [1].
- Simple average: add the last N prices and divide by N [2]. Exponential average: weights shrink geometrically into the past [3].
- Because it is built from past data, a moving average loses timeliness and can hide the latest change in trend [1].
- A longer window is smoother and slower; after a jump from $100 to $110, a 5-period simple average needs 5 periods to catch up (calculated).
- Traditional moving-average and filter rules on dollar exchange rates had become unprofitable by the early 1990s [4].
On this page
What is a moving average?#
The Federal Reserve Bank of Dallas defines a moving average as a calculation that smooths a volatile data series by averaging neighbouring data points [1]. The NIST statistics handbook describes the same idea as taking the mean of successive smaller sets of past data [2].
On a price chart, that usually means the average of the last N closing prices, redrawn every period. When a new candle closes, the oldest price drops out and the newest one comes in, so the average moves along with the chart. If you are new to the prices a candle records, start with how to read a candlestick chart.
simple moving average = (P1 + P2 + ... + PN) / N
How do you calculate a simple moving average?#
The NIST handbook gives the formula: the moving average at time t is the sum of the latest N values divided by N [2]. Its own worked example averages 9, 8 and 9 to get 8.667 [2]. Here is the same method on ten invented daily closing prices.
- Choose the window
Pick N, the number of periods. We use 3 and 5 days.
- Wait for enough data
A 3-day average needs three closes, so the first value appears on day 3. A 5-day average starts on day 5.
- Add and divide
Day 3: ($20.00 + $20.40 + $20.10) / 3 = $20.17 (calculated).
- Slide forward
On day 4, drop day 1 and add day 4, then divide again. Repeat every period.
| Day | Close | 3-day average | 5-day average |
|---|---|---|---|
| Day 1 | $20.00 | n/a | n/a |
| Day 2 | $20.40 | n/a | n/a |
| Day 3 | $20.10 | $20.17 | n/a |
| Day 4 | $20.80 | $20.43 | n/a |
| Day 5 | $21.20 | $20.70 | $20.50 |
| Day 6 | $21.00 | $21.00 | $20.70 |
| Day 7 | $21.60 | $21.27 | $20.94 |
| Day 8 | $22.30 | $21.63 | $21.38 |
| Day 9 | $21.90 | $21.93 | $21.60 |
| Day 10 | $22.50 | $22.23 | $21.86 |
n/a: not enough closes yet for that window. The 5-day line moves less from day to day than the 3-day line.
- Close, day 1 to day 10
- +$2.50$22.50 - $20.00, calculated
- 3-day average, day 5 to day 10
- +$1.53$22.23 - $20.70, calculated
- 5-day average, day 5 to day 10
- +$1.36$21.86 - $20.50, calculated
- Day 10 close above 5-day average
- $0.64$22.50 - $21.86, calculated
What is an exponential moving average?#
An exponential moving average (EMA) does not drop old prices outright. NIST describes exponential smoothing as weighting past observations with exponentially decreasing weights [3]. A smoothing constant, alpha, sits between 0 and 1. Each new value is alpha times the newest price plus (1 - alpha) times the previous average, and the weights, alpha × (1 - alpha) raised to the power t, decrease geometrically and add up to one [3].
NIST writes the recursion one step back because it uses the result as a forecast; on a chart it is applied to the newest close. Your charting platform chooses alpha from the period you enter, using its own rule, so check its help page rather than assuming.
EMA today = alpha × price today + (1 - alpha) × EMA yesterday
| Price | 5-day simple | EMA, alpha 0.5 | EMA, alpha 0.2 |
|---|---|---|---|
| Newest | 20% | 50% | 20% |
| 1 period back | 20% | 25% | 16% |
| 2 periods back | 20% | 12.5% | 12.8% |
| 3 periods back | 20% | 6.25% | 10.24% |
| 4 periods back | 20% | 3.125% | 8.192% |
| All older prices | 0% | 3.125% | 32.768% |
EMA weights from the formula alpha × (1 - alpha) to the power t [3]; each column adds up to 100%.
With alpha 0.5 the average is dominated by the last two prices. With alpha 0.2 almost a third of the weight still sits on prices beyond the five most recent (calculated). NIST puts it plainly: when alpha is close to 1, dampening is quick, and when it is close to 0, dampening is slow [3].
Why does a moving average lag behind price?#
Because it is made of the past. The Dallas Fed notes that since the calculation relies on historical data, some timeliness is lost, and the average may obscure the latest changes in the trend [1]. The smoother you make it, the later it reacts.
What is a moving-average crossover?#
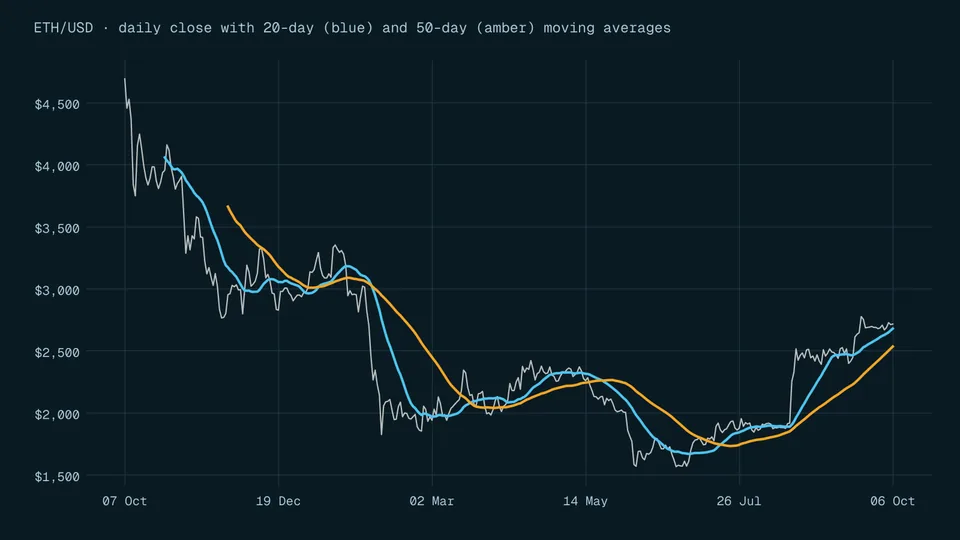
A crossover rule uses two averages, one short and one long. In a St. Louis Fed working paper by Christopher Neely and Paul Weller, the rule gives a buy signal when the short average crosses the long one from below and a sell signal when it crosses from above [4]. The paper's example, written MA(5, 20), compares a 5-day and a 20-day average [4].
We describe the rule so you can recognise it, not as a recommendation. Because both averages lag, a crossover arrives after the move that caused it has already happened, as the worked example above shows.
Do moving-average rules still make money?#
The best evidence we have is from currency markets, and it is a story of decline. In the same St. Louis Fed paper, Neely and Weller report that simple technical rules on dollar exchange rates provided about 15 years of positive risk-adjusted returns in the 1970s and 80s before those returns were extinguished [4]. Traditional moving-average and filter rules had become unprofitable by the early 1990s [4].
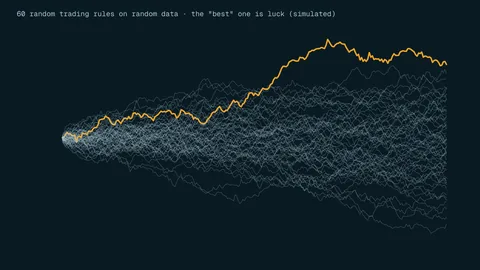
They also warn that apparent trading-rule profits can come from data snooping, publication bias and data mining, meaning that if enough rules are tested, some look good by chance [4]. Our page on backtesting pitfalls covers this in detail.
Costs matter too. The paper's lowest cost estimate, spreads of 2 basis points or less since 2000, is for currency trades of $5 million to $50 million [4], not for retail accounts. A rule that switches often pays the spread and fees every time; see trading fees explained.
Mistakes beginners make with moving averages#
- Treating the line as a prediction
A moving average summarises the past. It can hide the latest change in trend [1].
- Hunting for the perfect window
Trying many lengths until one fits past data is the data snooping the St. Louis Fed paper warns about [4].
- Assuming old results still hold
Rules that worked in the 1970s and 80s had stopped working in currencies by the early 1990s [4].
- Ignoring costs on frequent switches
Every crossover is a trade, and every trade pays a spread or fee. The paper's lowest cost estimates are for $5 million to $50 million trades [4], not small accounts.
- Mixing up simple and exponential
The same period number gives different lines. Check which type your platform draws and how it sets alpha.
Frequently asked questions#
What is the difference between a simple and an exponential moving average?
Which moving average length is best?
Do moving-average crossovers work?
In currency markets, traditional moving-average rules had become unprofitable by the early 1990s [4]. Our sources do not show them working today in any market.
Why does my moving average start a few candles in?
A 20-period average needs 20 prices before it can be calculated, so the line begins on the 20th candle of the chart.
The bottom line#
A moving average is just an average that slides along with the chart. It trades timeliness for smoothness, so it always reacts after price does. Learn to calculate one by hand, know whether your platform draws a simple or exponential line, and treat crossover rules as history to study, not a system to trust. Continue with our short moving average definition or see how analysts compare chart-based and economic approaches in technical vs fundamental analysis.
Sources
- Smoothing data with moving averages" (DataBasics).
- 6.4.2.1. Single Moving Average, NIST/SEMATECH e-Handbook of Statistical Methods.
- 6.4.3.1. Single Exponential Smoothing, NIST/SEMATECH e-Handbook of Statistical Methods.
- Technical Analysis in the Foreign Exchange Market" (Federal Reserve Bank of St. Louis Working Paper 2011-001B).
Education only. This page is not investment, tax or legal advice. Trading and crypto can lose you money. See our risk disclosure.