Glossary
Moving average definition
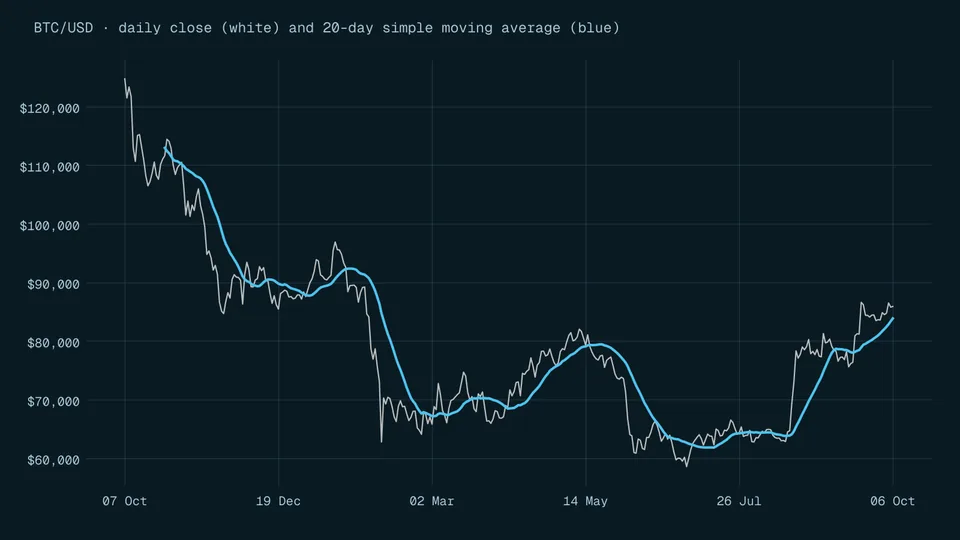
A moving average is one of the simplest lines you can add to a chart. It removes some of the noise, and it pays for that by always being a little late.
A moving average is the average of the most recent N values in a series, recalculated each period as the oldest value drops out and the newest is added. On a price chart it draws a smoother line that follows the price with a delay.
Quick answer
A moving average smooths a volatile series by averaging neighbouring data points [1]. A simple moving average is the mean of the latest N values [2]. Because it uses past data, it loses timeliness and can hide the latest change in trend [1].
Key points
On this page
What is a moving average?#
The Dallas Fed defines a moving average as a calculation that smooths a volatile data series by averaging neighbouring data points [1]. The NIST statistics handbook gives the simple version: take the mean of the latest N values, then move forward one step and repeat [2]. Its own worked example averages 9, 8 and 9 to get 8.667 [2].
The idea is not specific to trading. The Dallas Fed's example smooths monthly building permits: (18,900 + 18,397 + 18,000 + 19,237 + 17,623) / 5 gives 18,431 [1], or 18,431.4 before rounding (calculated). On a price chart, the same arithmetic is applied to closing prices, and the result is drawn as a line next to the candlesticks.
simple moving average = (latest value + previous value + ... + value N periods back) / N
How do you calculate a five-day moving average?#
Take seven invented daily closing prices: $20.00, $20.40, $19.80, $20.60, $21.20, $21.00 and $19.40. A five-day average needs five closes, so the first value appears on day 5.
| Day | Close | Five-day average | Close minus average |
|---|---|---|---|
| Day 5 | $21.20 | $20.40 | +$0.80 |
| Day 6 | $21.00 | $20.60 | +$0.40 |
| Day 7 | $19.40 | $20.40 | -$1.00 |
Invented prices; all averages calculated. Day 5 averages days 1 to 5, day 6 averages days 2 to 6, and so on.
What is the difference between a simple and an exponential moving average?#
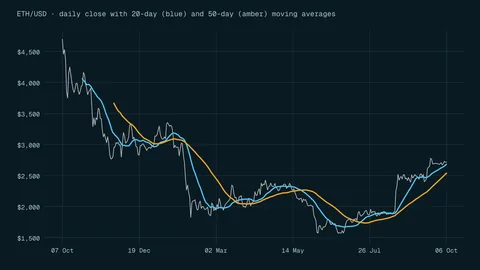
A simple moving average gives every value in the window the same weight [2]. Exponential smoothing, which the NIST handbook also calls an EWMA (exponentially weighted moving average), gives past observations weights that decrease geometrically and add up to one [3]. A smoothing constant between 0 and 1 controls it: close to 1 the average reacts quickly, close to 0 it reacts slowly [3].
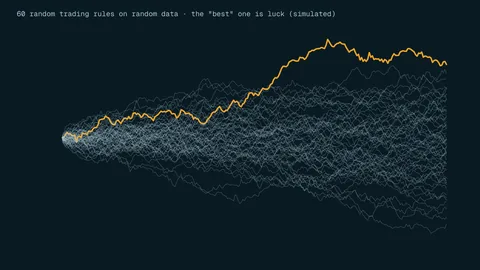
Moving averages are also used as trading signals. One rule studied by researchers buys when a short average crosses above a long one and sells when it crosses below, written for example as MA(5, 20) [4]. A St. Louis Fed review found traditional moving-average rules in currency markets had become unprofitable by the early 1990s [4], so treat a crossover as a description of recent prices, not a prediction. The full guide to moving averages and our page on backtesting pitfalls go further.
Frequently asked questions#
Which moving average length should I use?
None of the sources we cite names a best length. The Dallas Fed notes only that a larger window gives a smoother series [1], which also means a later one.
Does a price above its moving average mean the price will keep rising?
No. It means recent closes are above the recent average. Moving-average trading rules in currency markets stopped being profitable by the early 1990s [4].
Why does my moving average not start on the first day of the chart?
A five-day average needs five values before it can be calculated [2], so the line begins on the fifth period.
The bottom line#
A moving average is the mean of the last N values, recalculated every period. It smooths noise and always lags, and a longer window means more of both. Use it to describe what prices have done, not to predict them, and size any trade from the loss you can accept, as in position sizing. Read the risk disclosure before trading.
Sources
- Smoothing data with moving averages" (DataBasics).
- 6.4.2.1. Single Moving Average, NIST/SEMATECH e-Handbook of Statistical Methods.
- 6.4.3.1. Single Exponential Smoothing, NIST/SEMATECH e-Handbook of Statistical Methods.
- Technical Analysis in the Foreign Exchange Market" (Federal Reserve Bank of St. Louis Working Paper 2011-001B).
Education only. This page is not investment, tax or legal advice. Trading and crypto can lose you money. See our risk disclosure.