Glossary
Candlestick meaning: how to read one candle
A candlestick packs four prices into a single shape. Once you can read one candle, you can read a whole chart of them.
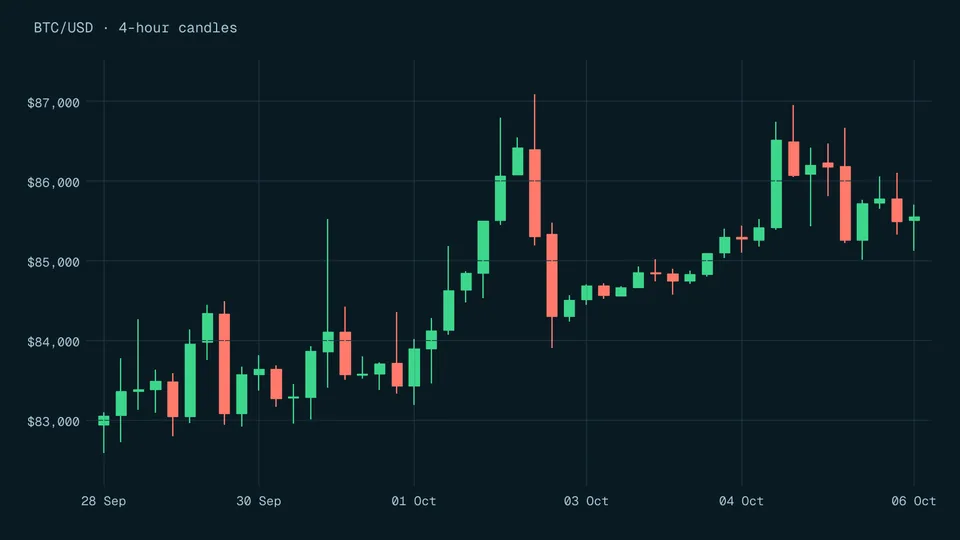
A candlestick is one bar on a price chart that shows four prices for a single period: the open, high, low and close. The thick body spans the open and close, and the thin lines above and below reach the period's high and low.
Quick answer
A candlestick shows one period's open, high, low and close. The body is the range between the open and close; the stick or wick reaches the highest and lowest prices traded [1] [3]. In a study of Thai stocks, most reversal patterns had mean returns not statistically different from zero [2].
Key points
- The body runs from the open to the close; the lines above and below show the high and low [2].
- Green or white usually means the close was above the open, red or black below it, but your software sets the colours [3] [2].
- A study of Thai stocks found the mean returns after most reversal patterns were not statistically different from zero [2].
On this page
What does a candlestick show?#
A candlestick chart is made of one stick per time period, for example one per day [1]. Each stick shows the range between the opening and closing prices (the body) and the highest and lowest prices traded [1]. Researchers call the box the real body and the thin lines the upper and lower shadows; the shadows mark the high and low of the period [2]. CME Group's education material calls the same lines wicks [3].
Colour tells you direction. CME Group's education page says a candle is generally green when the close is above the open and generally red when it is below, depending on the colour settings of your software [3]. Some research papers use white and black instead [2]. Check your own app's settings before you read a chart.
| Part of the candle | What it shows | In the example below |
|---|---|---|
| Body (real body) | Distance from the open to the close | $1.80 |
| Upper wick (shadow) | From the top of the body to the high | $0.60 |
| Lower wick (shadow) | From the bottom of the body to the low | $0.90 |
| Whole candle | From the low to the high | $3.30 |
Anatomy as described in [2] and [3]; example figures calculated from invented prices.
How do you read one candle?#
Reading the two together tells a simple story: day 1 closed near its high, day 2 gave back more than the whole of day 1's body. That is a description of what happened, not a forecast. A candle also hides the order of events inside the period: the day 2 candle cannot tell you whether the high came before the low. For the full guide, including how candles build into a chart, see how to read candlestick charts.
Do candlestick patterns predict prices?#
The evidence is weak and conditional. A study of the 50 stocks in Thailand's SET50 index from 2006 to 2016 found that the mean returns after most reversal patterns were not statistically different from zero, and even the patterns with significant returns carried high risk [2]. A study of Dow Jones stocks found some three-day reversal patterns profitable at a 0.5% transaction cost under one holding rule and not profitable under another [4]. In other words, the exit rule mattered as much as the pattern.
If a course or app shows you a pattern that worked on past charts, read our page on backtesting pitfalls first, and decide your exit and size before you trade, as in position sizing.
Frequently asked questions#
What is the difference between a candlestick and a bar chart?
Both show the open, high, low and close for each period [3]. A candlestick draws the open-to-close range as a filled body, which makes the direction easier to see at a glance.
Why is my candle green when the price fell today?
Colour compares each candle's close with its own open [3]. A candle can be green because it closed above where it opened, even if the price is lower than yesterday's close.
Where do candlestick charts come from?
One research paper credits the method to a Japanese rice merchant, Munehisa Homma, in 1750, citing earlier literature [2]. Treat it as a story about the name, not as evidence that the patterns work.
The bottom line#
A candlestick is a compact record of four prices: open, high, low and close. Learn to read the body and the wicks, check your app's colour settings, and remember that a candle describes the past. Patterns built from candles have weak, conditional evidence behind them, so plan your exit and risk before you trade. Read the risk disclosure before trading.
Sources
- DPP: Deep predictor for price movement from candlestick charts.
- Profitability of Candlestick Charting Patterns in the Stock Exchange of Thailand (Piyapas Tharavanij, Vasan Siraprapasiri, Kittichai Rajchamaha), SAGE Open, October-December 2017.
- Chart Types: candlestick, line, bar (CME Group Education, Technical Analysis course).
- Trend definition or holding strategy: What determines the profitability of candlestick charting?" (abstract, Journal of Banking & Finance 61(C), 2015, pp. 172-183).
Education only. This page is not investment, tax or legal advice. Trading and crypto can lose you money. See our risk disclosure.