Explainer · Charts & Analysis
Technical vs fundamental analysis
Technical analysis asks what the price has been doing. Fundamental analysis asks what the thing is worth. Neither one tells you what happens next, and both can be used to fool yourself.
Quick answer
Technical analysis uses past prices and other market data such as volume to guide trades. Fundamental analysis uses economic variables such as interest rates and growth [1]. Surveys of professionals found technical analysis dominates at horizons under a week [1]. Neither removes risk.
Key points
- Technical analysis studies price and volume history; fundamental analysis studies the economic forces behind supply and demand [1] [3].
- The CFTC notes technical analysis can work consistently only if prices do not move as a random walk [2].
- For companies, fundamentals start with the balance sheet, income statement and cash flow statement, and no single one tells the complete story [4].
- In surveys of professional currency traders, technical analysis was used far more at horizons under a week [1].
- Simple chart rules that once paid in currency markets stopped working by the early 1990s [1].
On this page
What is technical analysis?#
Technical analysis works from the chart. The St. Louis Fed defines it as the use of past price behavior and/or other market data, such as volume, to guide trading decisions [1]. The CFTC's glossary describes it as forecasting from patterns of price change, rates of change and changes in trading volume, without regard to underlying fundamental factors [2].
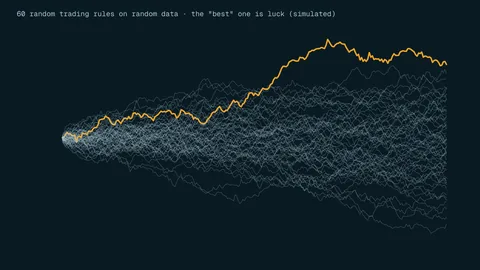
Typical tools are candlestick charts, support and resistance levels and moving averages. The CFTC adds an important condition in the same entry: technical analysis can work consistently only if the theory that price movements are a random walk is incorrect [2]. In other words, it needs patterns in past prices that repeat, and that is exactly what is in dispute.
What is fundamental analysis?#
Fundamental analysis works from the causes. The St. Louis Fed defines it as using economic variables such as interest rates and output growth rates to guide trading decisions [1]. The CFTC describes it as the study of the basic, underlying factors that affect supply and demand [3]. For a currency that might be interest rates and output growth; for a company it is the business itself.
For a company, the SEC's beginners' guide points to three statements: the balance sheet shows what a company owns and owes at a point in time, the income statement shows revenue over a period, and the cash flow statement reports cash coming in and going out [4]. It also warns that no one financial statement tells the complete story [4]. From these numbers come ratios such as earnings per share (EPS) and the price-to-earnings (P/E) ratio, which compares the share price with EPS [4].
- Earnings per share
- $2.00$10m / 5m shares, calculated
- P/E at $30
- 1530 / 2, calculated
- P/E at $45
- 22.545 / 2, calculated
How do the two approaches compare?#
The table sets the two side by side. The last row matters most for a beginner: each approach has its own way of going wrong.
| Question | Technical analysis | Fundamental analysis |
|---|---|---|
| What it reads | Past prices, volume and other market data | Economic data, company accounts, supply and demand |
| Question it asks | What has the price been doing? | What should this be worth, and why? |
| Use at horizons under a week | Used much more | Used much less |
| Typical way it fails | Seeing patterns in noise, tuning rules to old data | Being right about value but wrong about timing |
Definitions from the St. Louis Fed and CFTC [1] [2]; horizon evidence comes from surveys of professional currency traders and fund managers [1].
Who uses which approach, and over what horizon?#
Most of the evidence comes from professional currency markets. A 1992 survey by Taylor and Allen found that 90% of respondents used some form of technical analysis, and a 2001 study by Cheung and Chinn found that 30% of U.S. foreign exchange traders could best be described as technical analysts [1]. A New York Fed paper cites survey evidence that 25 to 30 percent of foreign exchange traders base most of their trades on technical signals [5].
Horizon is the clearer pattern. Survey evidence shows traders use technical analysis much more than fundamentals at horizons of less than a week, and the same dominance at short horizons holds for fund managers [1]. These surveys describe professionals, not retail traders, and they measure what people use, not what makes money.
Does either approach reliably work?#
Not reliably, and not forever. A St. Louis Fed review found that simple technical rules on dollar exchange rates produced about 15 years of positive, risk-adjusted returns in the 1970s and 80s before those returns were extinguished, and that traditional moving-average and filter rules had become unprofitable by the early 1990s [1]. On support and resistance, a New York Fed study found currency rates bounced off published levels 60.8% of the time against 56.2% for levels picked at random [5]. The paper calls that substantially more often than chance, yet random levels also bounced most of the time [5].
Fundamental analysis has its own limits. The SEC reminds readers that no one statement tells the complete story [4], and the sources we cite contain no head-to-head test showing that fundamentals beat charts, or the reverse. If someone tells you their method always works, check our page on backtesting pitfalls before you believe them.
How can a beginner use both without fooling themselves?#
- Match the tool to your horizon
At horizons under a week, professional surveys found traders use charts much more than fundamentals [1]. Know which horizon you are trading before you pick your tools. Our page on trading vs investing explains the difference.
- Write down why you are in the trade
One sentence for the reason (fundamental or technical) and one for what would prove it wrong.
- Set the exit before the entry
The chart can help you choose a stop level; the fundamentals cannot tell you when the market will agree with you.
- Size from the loss
Use a small, fixed amount at risk so that a wrong analysis is survivable.
- Review results, not stories
Record each trade and check later whether your reasons held up, not just whether the price moved your way.
Mistakes beginners make with technical and fundamental analysis#
- Treating a pattern as a promise
In the New York Fed study, published support and resistance levels held more often than random ones, but random levels also held 56.2% of the time [5].
- Using one statement or one ratio
The SEC says no single financial statement tells the complete story [4]. A ratio on its own cannot tell you why it is high or low.
- Mixing horizons
Buying on a long-term story, then panicking at a five-minute chart, gets the worst of both.
- Assuming an old edge still works
Currency trading rules that paid for years became unprofitable by the early 1990s [1].
- Arguing about methods instead of managing risk
Whichever approach you use, the loss on a wrong call is set by your stop and your size, not by your analysis.
Frequently asked questions#
Which is better, technical or fundamental analysis?
The sources we cite do not show that one beats the other. Surveys found professionals use technical analysis much more than fundamentals at horizons under a week [1]. Both can lose money.
Can fundamental analysis be used for crypto?
The SEC guide we cite covers company financial statements only [4]. It says nothing about valuing crypto assets [4], so treat company ratios such as P/E as company tools. Our crypto basics section covers what drives crypto prices and risks.
Do professional traders use technical analysis?
Many do. A 1992 survey cited by the St. Louis Fed found 90% of respondents used some form of it [1]. Using it is not the same as profiting from it.
The bottom line#
Technical analysis reads what the price has done; fundamental analysis reads why it might move. Professionals lean much more on charts at horizons under a week, and the evidence shows past edges can disappear. Pick the approach that fits your horizon, write down what would prove you wrong, and let position size, not conviction, decide how much you can lose. Read the risk disclosure before trading.
Sources
- Technical Analysis in the Foreign Exchange Market" (Federal Reserve Bank of St. Louis Working Paper 2011-001B).
- CFTC Glossary: A Guide to the Language of the Futures Industry (entries T).
- CFTC Glossary: A Guide to the Language of the Futures Industry (entries F).
- Beginners' Guide to Financial Statements.
- Support for Resistance: Technical Analysis and Intraday Exchange Rates.
Education only. This page is not investment, tax or legal advice. Trading and crypto can lose you money. See our risk disclosure.