News analysis ·
Order Book Churn on Bitcoin Perps: The Fill-Price Risk
Glassnode's new Book Churn metric counts how fast Bitcoin order books are rewritten. Here is what a churning book means for the price your order gets.
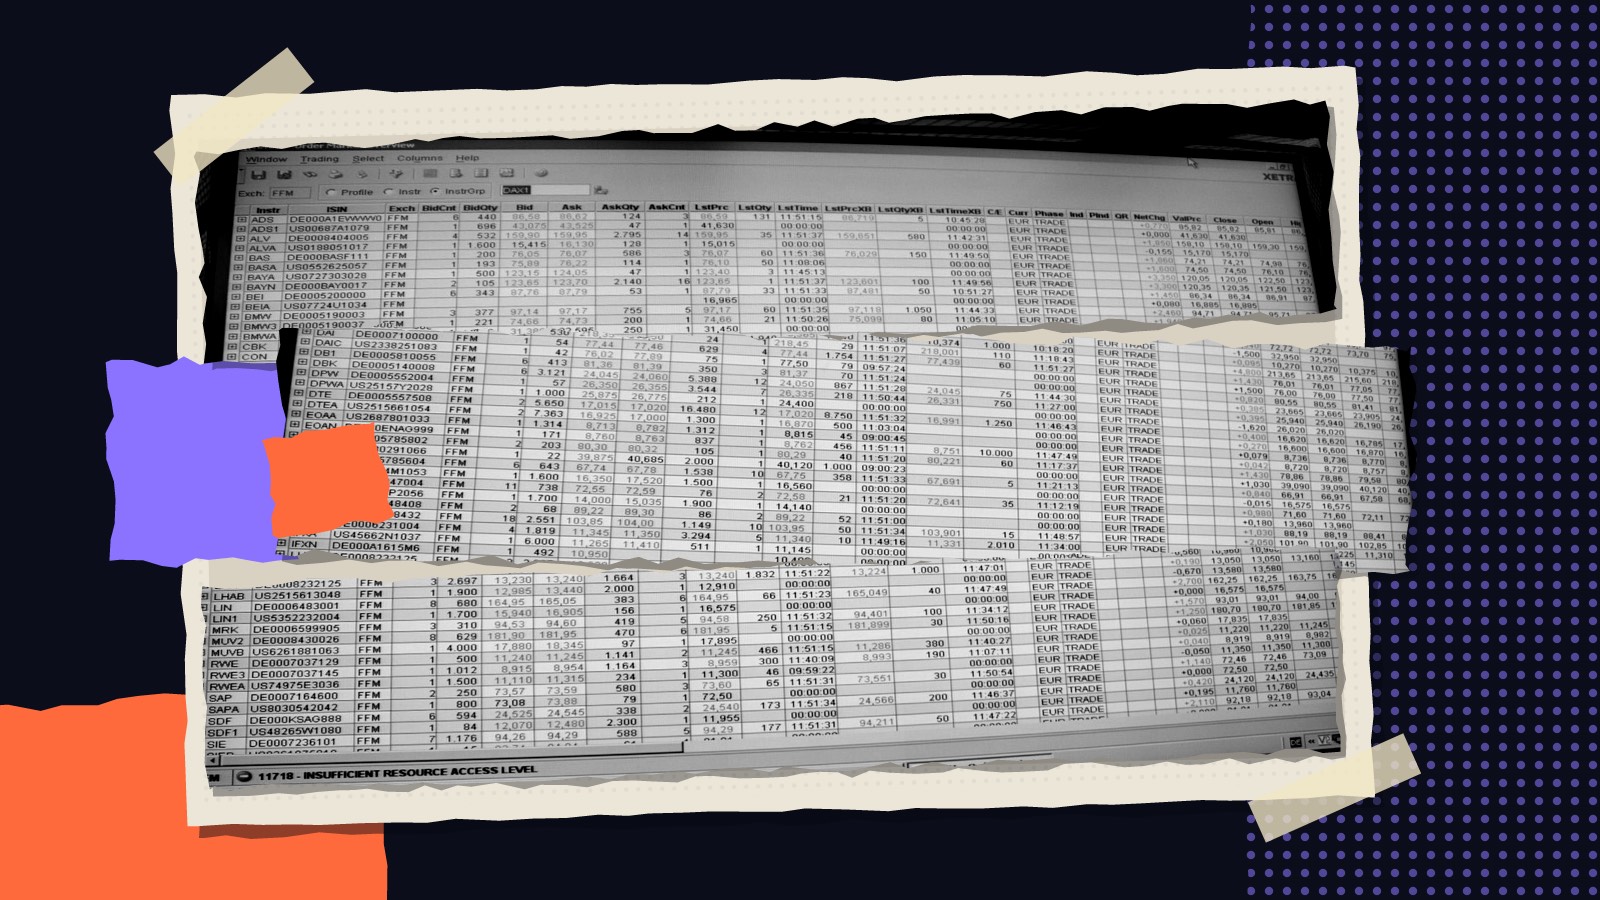
Analytics firm Glassnode published a new metric on 2026-11-18 called Book Churn, which counts how often the price levels in an exchange order book are revised. This article explains what a fast-changing order book means for the price a retail trader actually gets, and why the metric is a warning light rather than a crystal ball.
What Glassnode measured
An order book is the list of buy and sell orders waiting on an exchange at different prices. Traders usually check depth, meaning how much is resting near the current price, and spread, the gap between the best buy and sell prices. Glassnode argues both only describe the book at a single moment, not how quickly the quotes behind them are being replaced.
Book Churn fills that gap. It is published every ten minutes, and each interval is compared with the same instrument's prior thirty days at the matching hour of day, because activity in the book follows a strong daily cycle. The raw numbers are large: Glassnode counts roughly 607,000 level updates in a median ten-minute window for BTCUSDT and 548,000 for ETHUSDT.
The mechanics: why a steady-looking book can be unstable
The quotes in a crypto order book come largely from market makers, firms that post buy and sell orders and earn the spread. Glassnode describes the difference simply. A relaxed market maker leaves quotes alone. One that is repricing risk keeps cancelling and replacing them across many levels, even when the total depth on screen looks unchanged.
That is the key point for a retail trader. Depth can understate how much the book is moving. For BTCUSDT in a typical 2025 and 2026 month, Glassnode found the busiest intervals had about 3.9x the updates of the quietest, while depth within 1% of the price varied only 1.9x. The book you see when you click may not be the book that is there when your order arrives.
Heavy churn also tends to travel with worse trading conditions. Over 2020 to September 2026, BTCUSDT churn tracked spread at +0.49 and depth inside 100 basis points at -0.40, according to Glassnode. In plain terms, when quotes are being rewritten fast, the book is usually thinner and the spread wider.
Crypto risks when the order book churns
A busy book is not dangerous by itself. The danger comes from the orders you send into it, especially with leverage on a perpetual future, a contract with no expiry date that tracks the coin's price. Here are concrete ways a trader can lose money when churn is high:
- Market orders filling worse than expected. A market order takes whatever prices are resting. If the book is thin and quotes keep moving, the fill can land well away from the price you saw. That gap is called slippage.
- Stop-losses that exit at a worse price. A stop order usually becomes a market order once triggered. In a fast, thin book it can close your trade below the level you set, so the loss is bigger than planned.
- A wider spread as a hidden cost. When the spread widens, you pay more just to enter and exit. For short-term trades, that cost can eat a large share of any gain.
- Leverage magnifying a fast swing. On 21 September 2026 at 08:30 UTC, Bitcoin perpetuals logged about 3.4 million updates in ten minutes, 4.13x their thirty-day average, alongside a 2.26% low-to-high swing. With a highly leveraged position, a swing that size inside ten minutes can wipe out much of the margin.
A limit order, which sets the worst price you will accept, controls the fill price but carries its own risk: in a moving market it may not fill at all.
What the metric cannot tell you
Glassnode is careful about the limits. Backtested on the Binance perpetuals since 2020, a reading two standard deviations above normal was followed by an above-median volatility hour in about 63% of cases, where pure chance would give 50%. But a reading taken 24 hours earlier already scored about 59%. Much of the edge, the firm says, reflects volatile stretches that last for days rather than fresh information.
A simple price-range signal using only past data did about as well: churn scored 63.2% against 63.7% for the range signal on BTCUSDT, a gap Glassnode found statistically indistinguishable from zero. Churn also peaks alongside the price move rather than before it, and it has no direction, so it cannot say whether price will rise or fall. As the Glassnode research note puts it, "It does not warn of volatility in a calm market."
There are data caveats too. Quotes change for reasons besides repricing risk, such as queue management and latency defense, and a raw count cannot separate them.
What to watch
For most retail traders, the practical lesson is less about the metric and more about the market it describes. When price is already moving sharply, assume the book behind it is thinner and changing faster than the screen suggests. That is when order type, position size and leverage matter most.
Anyone thinking of using churn data to time trades should note that Glassnode has not published the delay between an interval closing and the data reaching its API. The firm says that delay should be measured first.
Sources
- Glassnode, 18 Nov 2026
Drafted with an AI model using only the sources listed, and released automatically after software checks on figures and originality. Nobody edited it by hand. For learning only; it does not tell you what to buy or sell.